Analytics Features
Everything Zenovay measures, in one place. From the real-time dashboard to advanced segmentation and quality metrics, these reports turn raw traffic into decisions you can act on.
Dashboard & Real Time
Dashboard Overview
Read your visitor data at a glance and find every report.
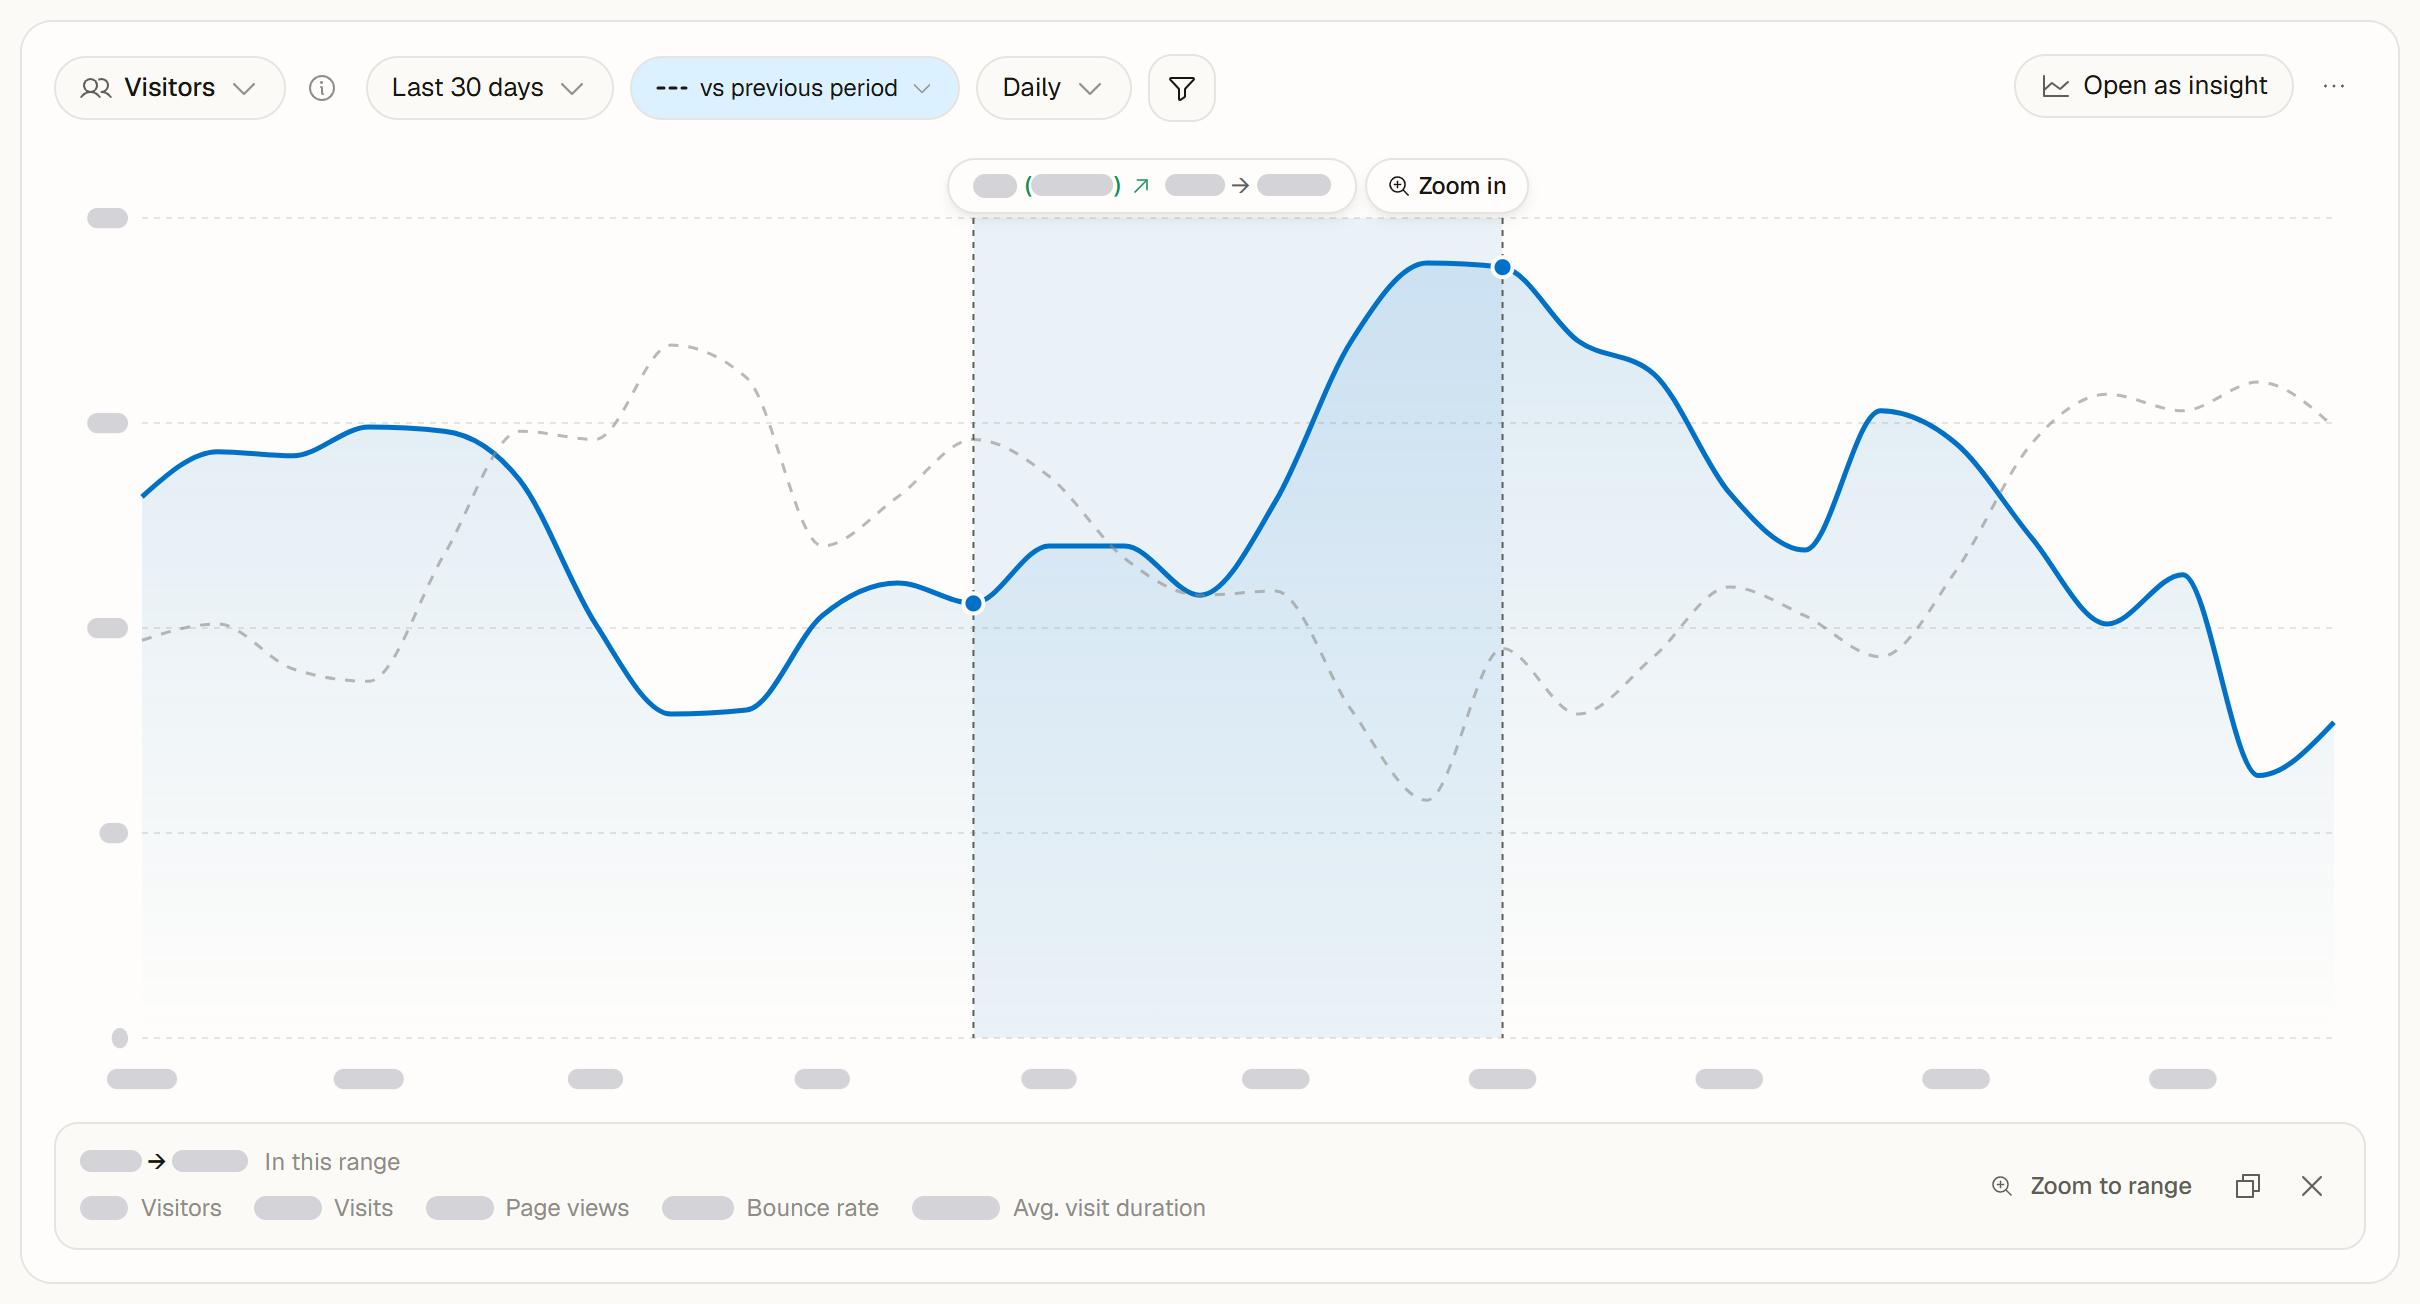
Main Chart
Five metrics, period comparison, range measurement and goal lines.
Insight View
Several metrics, chart types, detailed results and saved insights.
Live View
Watch active visitors arrive on your site in real time.
Real-time Tracking
Monitor visitor activity as it happens, second by second.
Visitor Value Scoring
AI scoring that surfaces your most valuable visitors.
Behavior & Quality
Page Flows
Follow visits from their source through every page to their exit.
Users in Journeys
One row per person, sortable by every column, with your own columns.
Page Quality Metrics
Bounce rate per entry page, exit rate and median time on page.
Scroll Depth
Milestones, funnel chart, and a scroll heatmap overlay.
Core Web Vitals
Real-user LCP, CLS, INP, FCP, and TTFB from every session.
Uptime
Availability, response time, incidents and SSL for your site.
Retention
How many new visitors come back, and their lifetime value.
Cohort Bounce
A heat grid of bounce rate by landing page and channel.
Saved Segments
Build and re-apply named visitor segments across 19 dimensions.
Audience & Compliance
Demographics
Languages by name, locations and the local time of visits.
AI Influence
See which AI bots crawl you and which AI products send traffic.
Consent & Privacy Metrics
Track how your own consent banner performs over time.
Data Export
Every export: CSV and Excel downloads, email, warehouse and API.
Reconciliation
Estimate tracking loss by comparing client and server counts.
Go Deeper
Learn how the data gets collected in Tracking, or explore advanced reports in Pro Features.
On this page