Construir un Panel de Análisis Personalizado
Esta guía te muestra cómo construir un panel de análisis personalizado que muestre tus datos de Zenovay. Aprenderás la arquitectura recomendada, cómo hacer proxy de llamadas a la API de forma segura y cómo construir gráficos, mapas y contadores de visitantes en tiempo real.
Requisitos Previos
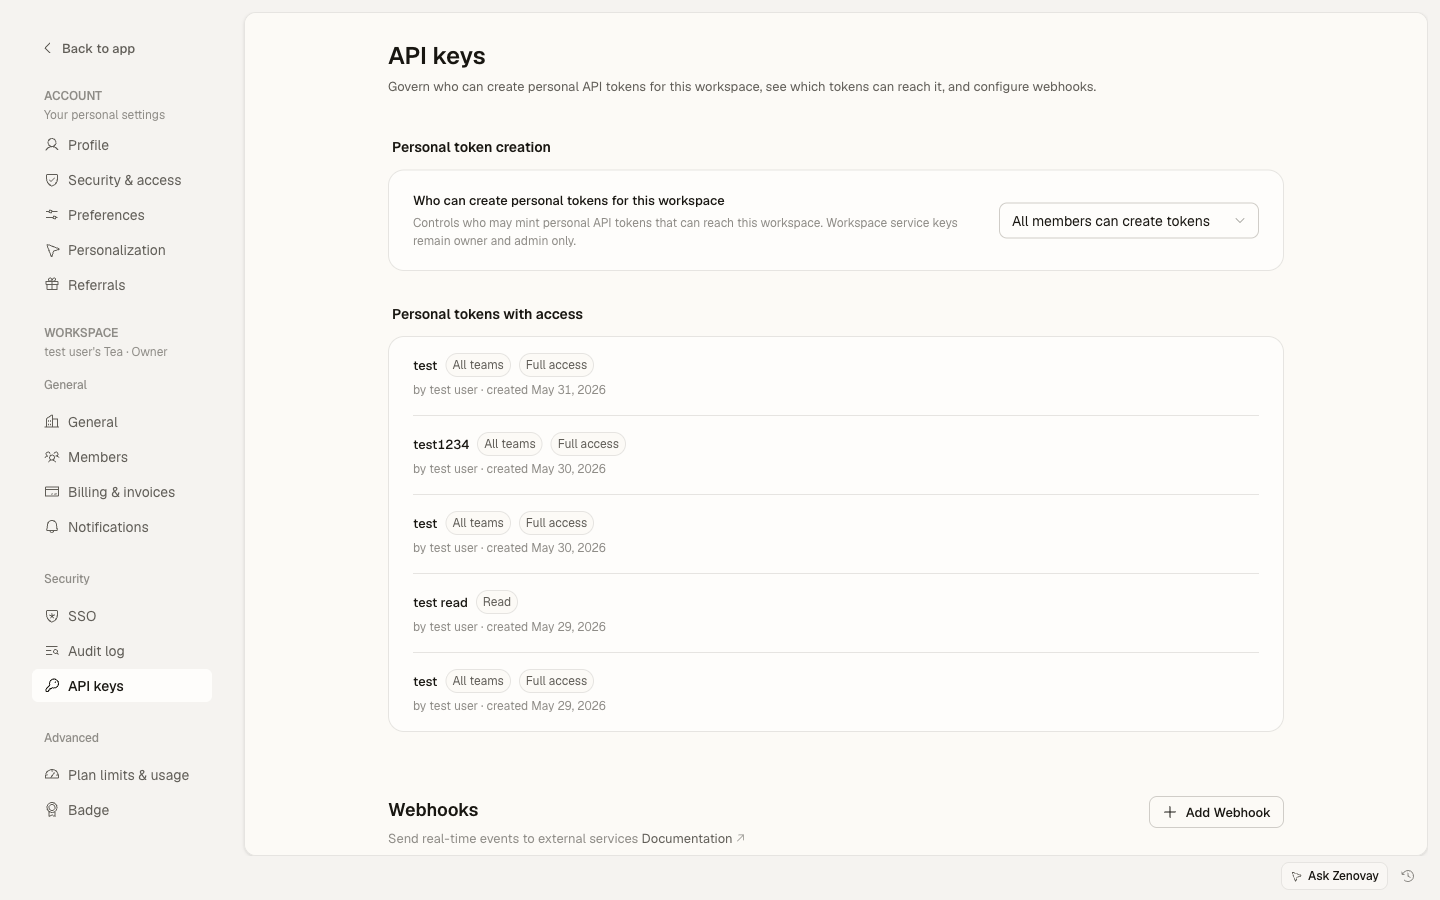
Necesitas una clave de API de Zenovay antes de hacer cualquier llamada a la API. Ve a Settings → Security → API keys para crear una. El acceso a la API requiere un plan pagado.
Descripción General de la Arquitectura
El patrón recomendado usa un proxy del lado del servidor para mantener tu clave de API segura:
Browser  -->  Your Backend  -->  Zenovay API
                (proxy)          api.zenovay.com
Nunca expongas tu clave de API de Zenovay en JavaScript del lado del cliente. Siempre haz proxy de las solicitudes a través de tu propio servidor.
Configurar un Proxy del Lado del Servidor
import { NextResponse } from 'next/server';

const ZENOVAY_API_KEY = process.env.ZENOVAY_API_KEY!;
const ZENOVAY_BASE_URL = 'https://api.zenovay.com/api/external/v1';

export async function GET(request: Request) {
const { searchParams } = new URL(request.url);
const websiteId = searchParams.get('websiteId');
const endpoint = searchParams.get('endpoint') || '';
const range = searchParams.get('range') || '7d';

if (!websiteId) {
  return NextResponse.json({ error: 'websiteId required' }, { status: 400 });
}

const url = `${ZENOVAY_BASE_URL}/analytics/${websiteId}${endpoint ? '/' + endpoint : ''}?range=${range}`;

const response = await fetch(url, {
  headers: { 'X-API-Key': ZENOVAY_API_KEY },
});

const data = await response.json();
return NextResponse.json(data);
}
Obtener Datos de Descripción General del Análisis
El endpoint /analytics/:websiteId devuelve estadísticas de resumen y desgloses diarios:
const API_BASE = '/api/analytics'; // Your proxy endpoint

export interface AnalyticsOverview {
website: { id: string; domain: string; name: string };
time_range: string;
summary: {
  total_visitors: number;
  total_page_views: number;
  unique_visitors: number;
};
daily_stats: Array<{
  date: string;
  total_visitors: number;
  page_views: number;
  unique_visitors: number;
}>;
}

export async function fetchOverview(
websiteId: string,
range = '7d'
): Promise<AnalyticsOverview> {
const res = await fetch(
  `${API_BASE}?websiteId=${websiteId}&range=${range}`
);
const json = await res.json();

if (!json.success) throw new Error(json.error?.message || 'API error');
return json.data;
}

export async function fetchCountries(websiteId: string, range = '7d') {
const res = await fetch(
  `${API_BASE}?websiteId=${websiteId}&endpoint=countries&range=${range}`
);
const json = await res.json();
if (!json.success) throw new Error(json.error?.message || 'API error');
return json.data.countries;
}

export async function fetchTechnology(websiteId: string, range = '7d') {
const res = await fetch(
  `${API_BASE}?websiteId=${websiteId}&endpoint=technology&range=${range}`
);
const json = await res.json();
if (!json.success) throw new Error(json.error?.message || 'API error');
return json.data;
}
Construir Gráficos de Visitantes
Usa el array daily_stats de la descripción general de análisis para construir gráficos de series de tiempo. Aquí hay un ejemplo usando un lienzo HTML simple, pero puedes usar cualquier biblioteca de gráficos (Chart.js, Recharts, etc.):
'use client';

import { useEffect, useState } from 'react';
import { fetchOverview, type AnalyticsOverview } from '@/lib/zenovay';

interface Props {
websiteId: string;
range?: string;
}

export function VisitorChart({ websiteId, range = '7d' }: Props) {
const [data, setData] = useState<AnalyticsOverview | null>(null);
const [loading, setLoading] = useState(true);

useEffect(() => {
  fetchOverview(websiteId, range)
    .then(setData)
    .finally(() => setLoading(false));
}, [websiteId, range]);

if (loading) return <div>Loading chart...</div>;
if (!data) return <div>No data available</div>;

const { daily_stats, summary } = data;
const maxViews = Math.max(...daily_stats.map(d => d.page_views));

return (
  <div>
    <div style={{ display: 'flex', gap: '2rem', marginBottom: '1rem' }}>
      <div>
        <strong>{summary.total_visitors.toLocaleString()}</strong>
        <div>Total Visitors</div>
      </div>
      <div>
        <strong>{summary.total_page_views.toLocaleString()}</strong>
        <div>Page Views</div>
      </div>
      <div>
        <strong>{summary.unique_visitors.toLocaleString()}</strong>
        <div>Unique Visitors</div>
      </div>
    </div>

    <div style={{ display: 'flex', alignItems: 'flex-end', gap: '2px', height: '200px' }}>
      {daily_stats.map((day) => (
        <div
          key={day.date}
          title={`${day.date}: ${day.page_views} views`}
          style={{
            flex: 1,
            height: `${(day.page_views / maxViews) * 100}%`,
            backgroundColor: '#3b82f6',
            borderRadius: '2px 2px 0 0',
            minHeight: '2px',
          }}
        />
      ))}
    </div>

    <div style={{ display: 'flex', justifyContent: 'space-between', fontSize: '0.75rem' }}>
      <span>{daily_stats[0]?.date}</span>
      <span>{daily_stats[daily_stats.length - 1]?.date}</span>
    </div>
  </div>
);
}
Mapa Geográfico
Usa el endpoint /analytics/:websiteId/countries para mostrar ubicaciones de visitantes. La respuesta incluye códigos de país que funcionan con cualquier biblioteca de mapas:
'use client';

import { useEffect, useState } from 'react';
import { fetchCountries } from '@/lib/zenovay';

interface Country {
country_code: string;
country_name: string;
visitors: number;
avg_value_score: number;
}

export function CountryTable({ websiteId }: { websiteId: string }) {
const [countries, setCountries] = useState<Country[]>([]);

useEffect(() => {
  fetchCountries(websiteId, '30d').then(setCountries);
}, [websiteId]);

const total = countries.reduce((sum, c) => sum + c.visitors, 0);

return (
  <table style={{ width: '100%', borderCollapse: 'collapse' }}>
    <thead>
      <tr>
        <th style={{ textAlign: 'left' }}>Country</th>
        <th style={{ textAlign: 'right' }}>Visitors</th>
        <th style={{ textAlign: 'right' }}>%</th>
      </tr>
    </thead>
    <tbody>
      {countries.map((country) => (
        <tr key={country.country_code}>
          <td>{country.country_name}</td>
          <td style={{ textAlign: 'right' }}>{country.visitors.toLocaleString()}</td>
          <td style={{ textAlign: 'right' }}>
            {total > 0 ? ((country.visitors / total) * 100).toFixed(1) : 0}%
          </td>
        </tr>
      ))}
    </tbody>
  </table>
);
}
Para un mapa interactivo, empareja los datos del país con una biblioteca como react-simple-maps o Mapbox GL JS. El campo country_code utiliza códigos ISO 3166-1 alpha-2 que estas bibliotecas entienden directamente.
Desglose de Tecnología
Muestra estadísticas de dispositivo, navegador y SO desde /analytics/:websiteId/technology:
'use client';

import { useEffect, useState } from 'react';
import { fetchTechnology } from '@/lib/zenovay';

interface TechItem {
name: string;
count: number;
percentage: number;
}

function BarList({ items, label }: { items: TechItem[]; label: string }) {
return (
  <div>
    <h3>{label}</h3>
    {items.slice(0, 5).map((item) => (
      <div key={item.name} style={{ marginBottom: '0.5rem' }}>
        <div style={{ display: 'flex', justifyContent: 'space-between' }}>
          <span>{item.name}</span>
          <span>{item.percentage}%</span>
        </div>
        <div style={{ background: '#e5e7eb', borderRadius: '4px', height: '8px' }}>
          <div
            style={{
              width: `${item.percentage}%`,
              background: '#3b82f6',
              borderRadius: '4px',
              height: '100%',
            }}
          />
        </div>
      </div>
    ))}
  </div>
);
}

export function TechBreakdown({ websiteId }: { websiteId: string }) {
const [tech, setTech] = useState<{
  devices: TechItem[];
  browsers: TechItem[];
  operating_systems: TechItem[];
} | null>(null);

useEffect(() => {
  fetchTechnology(websiteId).then(setTech);
}, [websiteId]);

if (!tech) return <div>Loading...</div>;

return (
  <div style={{ display: 'grid', gridTemplateColumns: '1fr 1fr 1fr', gap: '2rem' }}>
    <BarList items={tech.devices} label="Devices" />
    <BarList items={tech.browsers} label="Browsers" />
    <BarList items={tech.operating_systems} label="Operating Systems" />
  </div>
);
}
Contador de Visitantes en Tiempo Real
El endpoint de visitante en vivo es público y no requiere autenticación:
GET https://api.zenovay.com/e/live/YOUR_TRACKING_CODE
Esto lo hace seguro para llamar directamente desde el navegador. Haz polling cada 10 segundos para un contador en vivo:
'use client';

import { useEffect, useState } from 'react';

export function LiveVisitors({ trackingCode }: { trackingCode: string }) {
const [count, setCount] = useState<number | null>(null);

useEffect(() => {
  const fetchLive = async () => {
    try {
      const res = await fetch(
        `https://api.zenovay.com/e/live/${trackingCode}`
      );
      const data = await res.json();
      setCount(data.visitors ?? data.data?.visitors ?? 0);
    } catch {
      // Silently fail -- keep last known count
    }
  };

  fetchLive();
  const interval = setInterval(fetchLive, 10_000);
  return () => clearInterval(interval);
}, [trackingCode]);

return (
  <div style={{ display: 'flex', alignItems: 'center', gap: '0.5rem' }}>
    <span
      style={{
        width: '8px',
        height: '8px',
        borderRadius: '50%',
        backgroundColor: count !== null ? '#22c55e' : '#9ca3af',
        display: 'inline-block',
      }}
    />
    <span>
      {count !== null ? count.toLocaleString() : '--'} visitor{count !== 1 ? 's' : ''} online
    </span>
  </div>
);
}
Unir Todo Junto
Aquí hay una página de panel completa que combina todos los componentes:
import { VisitorChart } from '@/components/VisitorChart';
import { CountryTable } from '@/components/CountryTable';
import { TechBreakdown } from '@/components/TechBreakdown';
import { LiveVisitors } from '@/components/LiveVisitors';

const WEBSITE_ID = 'ws_abc123';         // Your Zenovay website ID
const TRACKING_CODE = 'ZV_XXXXXXXXXXX';  // Your tracking code

export default function DashboardPage() {
return (
  <div style={{ maxWidth: '1200px', margin: '0 auto', padding: '2rem' }}>
    <div style={{ display: 'flex', justifyContent: 'space-between', alignItems: 'center' }}>
      <h1>Analytics Dashboard</h1>
      <LiveVisitors trackingCode={TRACKING_CODE} />
    </div>

    <section style={{ marginTop: '2rem' }}>
      <h2>Visitor Trends</h2>
      <VisitorChart websiteId={WEBSITE_ID} range="30d" />
    </section>

    <section style={{ marginTop: '2rem' }}>
      <h2>Technology</h2>
      <TechBreakdown websiteId={WEBSITE_ID} />
    </section>

    <section style={{ marginTop: '2rem' }}>
      <h2>Top Countries</h2>
      <CountryTable websiteId={WEBSITE_ID} />
    </section>
  </div>
);
}
Próximos Pasos
- Primeros Pasos con la API -- Configuración de clave de API y autenticación
- Análisis del Lado del Servidor -- Envolturas de Node.js y Python para canalizaciones de backend
- Webhook y Datos en Tiempo Real -- Patrones avanzados de polling y alertas
- Referencia de API Externa -- Documentación completa de endpoints