Rastreamento de Erros
Recurso ProCapture todos os erros JavaScript, falhas de rede e exceções não tratadas antes que seus usuários as reportem. O rastreamento de erros captura rastreamentos de pilha completos com contexto de sessão para ajudá-lo a depurar mais rapidamente.
O Rastreamento de Erros está disponível nos planos Pro, Scale e Enterprise. Atualize seu plano para habilitar este recurso.
Visão Geral
Zenovay captura automaticamente erros do lado do cliente conforme ocorrem, incluindo:
- Erros JavaScript: Exceções não capturadas e erros de sintaxe
- Rejeições de Promise: Rejeições de promise não tratadas
- Erros de Rede: Falhas em chamadas de API e carregamento de recursos
- Erros do Console: Erros registrados via
console.error()
Cada erro inclui:
- Rastreamento de pilha completo com source maps
- Contexto de sessão (o que o usuário estava fazendo)
- Informações do navegador e dispositivo
- Link para reprodução de sessão (se habilitado)
Habilitando Rastreamento de Erros
O rastreamento de erros é habilitado por padrão quando você adiciona o script de rastreamento Zenovay. Para verificar:
- Abra Domínios, selecione seu site e escolha a aba Erros
- Se a aba mostrar dados ou um prompt para habilitar, o script está ativo
- Confirme que a captura de erros está ativada nas configurações de recursos do domínio
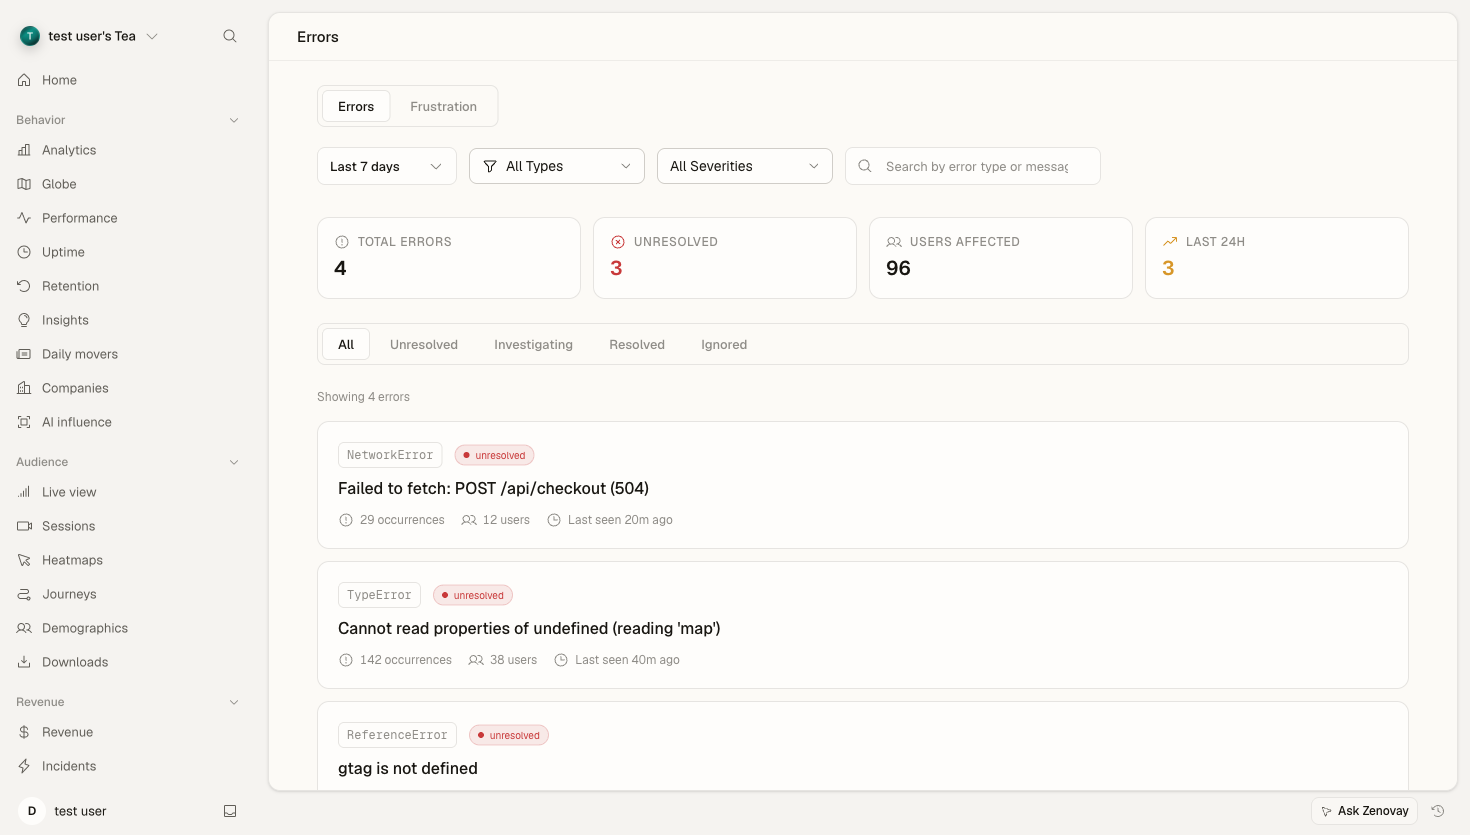
Painel de Erros
Lista de Erros
O painel Erros mostra todos os erros capturados agrupados por:
- Mensagem de erro: Identificador único de erro
- Contagem de ocorrências: Quantas vezes este erro ocorreu
- Usuários afetados: Número de visitantes únicos afetados
- Visto pela última vez: Quando o erro foi visto mais recentemente
Detalhes do Erro
Clique em qualquer erro para ver:
- Rastreamento de pilha completo: Com números de linha mapeados
- Contexto do usuário: Navegador, dispositivo, país, URL da página
- Reprodução de sessão: Link para assistir o que aconteceu (se habilitado)
- Breadcrumbs: Eventos que levaram ao erro
- Gráfico de tendência: Frequência do erro ao longo do tempo
Agrupamento de Erros
Erros semelhantes são agrupados automaticamente por:
- Mensagem de erro (normalizada)
- Impressão digital do rastreamento de pilha
- Tipo de erro
Isso impede que milhares de erros idênticos inundem seu painel.
Impressão Digital Personalizada
Use tags de erro personalizadas para agrupar erros relacionados:
try {
  // Your code
} catch (error) {
  window.zenovay('track', 'error', {
    error_message: error.message,
    error_stack: error.stack,
    tags: {
      feature: 'checkout',
      action: 'payment_submit'
    }
  });
}
Tipos de Erro
Erros JavaScript
Erros de tempo de execução padrão:
// Captured automatically
TypeError: Cannot read property 'foo' of undefined
ReferenceError: bar is not defined
SyntaxError: Unexpected token
Erros de Rede
Solicitações de fetch/XHR falhadas:
// Failed API call - automatically captured
fetch('/api/data')
  .then(r => r.json())
  .catch(error => {
    // Error captured with request details
  });
Detalhes de erro de rede incluem:
- URL da solicitação
- Método HTTP
- Status da resposta (se disponível)
- Duração da solicitação
Rejeições de Promise
Rejeições de promise não tratadas:
// Captured automatically
Promise.reject(new Error('Something went wrong'));

// Async function errors
async function fetchData() {
  throw new Error('Failed to fetch');
}
Source Maps
Faça upload de source maps para rastreamentos de pilha legíveis:
Upload Automático (Recomendado)
Se estiver usando Webpack, Vite ou Rollup, os source maps podem ser carregados automaticamente durante a compilação:
# Upload source maps using the API
curl -X POST "https://api.zenovay.com/api/external/v1/sourcemaps" \
  -H "X-API-Key: YOUR_API_KEY" \
  -F "release=v1.2.3" \
  -F "sourcemap=@./dist/main.js.map"
Upload Manual
Faça upload através do painel:
- Abra Domínios, selecione seu site e escolha a aba Erros
- Clique em Source Maps e depois em Upload Source Map
- Selecione seus arquivos
.js.map - Associe com uma versão de lançamento
Integração de Sessão
Quando a Reprodução de Sessão está habilitada:
- Cada erro se vincula diretamente à reprodução de sessão
- A reprodução abre no momento exato em que o erro ocorreu
- Observe o que o usuário fez antes do erro
- Compreenda o contexto completo, não apenas o rastreamento de pilha
Filtros e Alertas
Filtro de Erros
Filtre erros por:
- Intervalo de datas
- Navegador
- Tipo de dispositivo
- País
- Versão de lançamento
- Tipo de erro
Alertas de Erro
Configure alertas para erros novos ou em pico:
- Abra Domínios, selecione seu site e escolha a aba Erros
- Clique em Configurar alertas
- Defina um limite (ex: "mais de 10 ocorrências em 5 minutos")
- Escolha um canal de notificação (email, Slack, webhook)
Ignorando Erros
Alguns erros não são acionáveis. Configure regras de ignorar:
Por Mensagem de Erro
{
  "error_ignore_patterns": [
    "ResizeObserver loop limit exceeded",
    "Script error."
  ]
}
Por Padrão de URL
{
  "error_ignore_urls": [
    "chrome-extension://",
    "moz-extension://"
  ]
}
Rastreamento Manual de Erros
Rastreie erros capturados ou condições de erro personalizadas:
// Track caught error
try {
  riskyOperation();
} catch (error) {
  window.zenovay('track', 'error', {
    error_message: error.message,
    error_stack: error.stack,
    context: {
      operation: 'riskyOperation',
      userId: currentUser.id
    }
  });
}

// Track custom error condition
if (unexpectedState) {
  window.zenovay('track', 'error', {
    error_message: 'Unexpected application state',
    severity: 'warning',
    context: { state: JSON.stringify(appState) }
  });
}
Acesso à API
Acesse dados de erro via API:
# List errors
GET /api/websites/:websiteId/errors
Authorization: Bearer YOUR_API_KEY

# Get error details
GET /api/websites/:websiteId/errors/:errorId
Authorization: Bearer YOUR_API_KEY
Privacidade
O rastreamento de erros respeita a privacidade do usuário:
- Rastreamentos de pilha não contêm dados do usuário
- PII é automaticamente removido do contexto do erro
- Respeita configurações DNT e consentimento
- Dados de erro seguem sua política de retenção
Melhores Práticas
- Faça upload de source maps: Essencial para depurar código minificado
- Configure alertas: Saiba sobre erros críticos imediatamente
- Revise semanalmente: Revisão regular de erros previne débito técnico
- Marque versões: Associe erros com versões específicas
- Assista reproduções de sessão: O contexto é tudo para depuração
Próximos Passos
- Reprodução de Sessão - Assista o que os usuários fizeram antes dos erros
- Heatmaps - Visualize interações de usuários
- Solução de Problemas - Depure problemas comuns