Construindo um Dashboard de Análise Personalizado
Este guia mostra como construir um dashboard de análise personalizado que exibe seus dados do Zenovay. Você aprenderá a arquitetura recomendada, como fazer proxy de chamadas de API com segurança e como construir gráficos, mapas e contadores de visitantes em tempo real.
Pré-requisitos
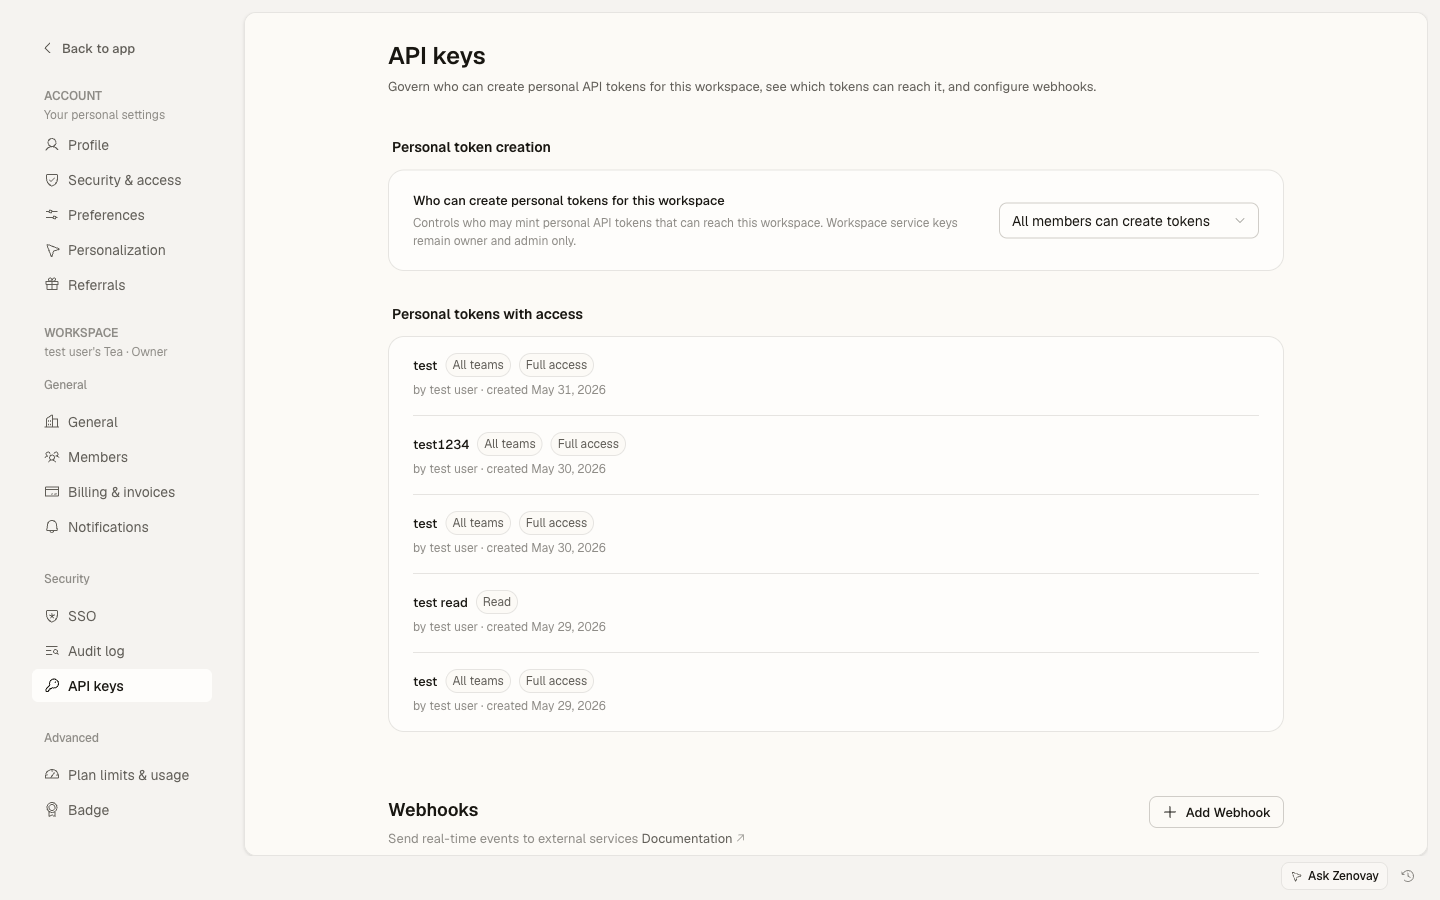
Você precisa de uma chave de API do Zenovay antes de fazer qualquer chamada de API. Vá para Settings → Security → API keys para criar uma. O acesso à API requer um plano pago.
Visão Geral da Arquitetura
O padrão recomendado usa um proxy do lado do servidor para manter sua chave de API segura:
Browser  -->  Your Backend  -->  Zenovay API
                (proxy)          api.zenovay.com
Nunca exponha sua chave de API do Zenovay em JavaScript do lado do cliente. Sempre faça proxy de solicitações através do seu próprio servidor.
Configurando um Proxy do Lado do Servidor
import { NextResponse } from 'next/server';

const ZENOVAY_API_KEY = process.env.ZENOVAY_API_KEY!;
const ZENOVAY_BASE_URL = 'https://api.zenovay.com/api/external/v1';

export async function GET(request: Request) {
const { searchParams } = new URL(request.url);
const websiteId = searchParams.get('websiteId');
const endpoint = searchParams.get('endpoint') || '';
const range = searchParams.get('range') || '7d';

if (!websiteId) {
  return NextResponse.json({ error: 'websiteId required' }, { status: 400 });
}

const url = `${ZENOVAY_BASE_URL}/analytics/${websiteId}${endpoint ? '/' + endpoint : ''}?range=${range}`;

const response = await fetch(url, {
  headers: { 'X-API-Key': ZENOVAY_API_KEY },
});

const data = await response.json();
return NextResponse.json(data);
}
Buscando Dados de Visão Geral de Análises
O endpoint /analytics/:websiteId retorna estatísticas resumidas e desagregações diárias:
const API_BASE = '/api/analytics'; // Your proxy endpoint

export interface AnalyticsOverview {
website: { id: string; domain: string; name: string };
time_range: string;
summary: {
  total_visitors: number;
  total_page_views: number;
  unique_visitors: number;
};
daily_stats: Array<{
  date: string;
  total_visitors: number;
  page_views: number;
  unique_visitors: number;
}>;
}

export async function fetchOverview(
websiteId: string,
range = '7d'
): Promise<AnalyticsOverview> {
const res = await fetch(
  `${API_BASE}?websiteId=${websiteId}&range=${range}`
);
const json = await res.json();

if (!json.success) throw new Error(json.error?.message || 'API error');
return json.data;
}

export async function fetchCountries(websiteId: string, range = '7d') {
const res = await fetch(
  `${API_BASE}?websiteId=${websiteId}&endpoint=countries&range=${range}`
);
const json = await res.json();
if (!json.success) throw new Error(json.error?.message || 'API error');
return json.data.countries;
}

export async function fetchTechnology(websiteId: string, range = '7d') {
const res = await fetch(
  `${API_BASE}?websiteId=${websiteId}&endpoint=technology&range=${range}`
);
const json = await res.json();
if (!json.success) throw new Error(json.error?.message || 'API error');
return json.data;
}
Construindo Gráficos de Visitantes
Use o array daily_stats da visão geral de análises para construir gráficos de série temporal. Aqui está um exemplo usando um canvas HTML simples, mas você pode usar qualquer biblioteca de gráficos (Chart.js, Recharts, etc.):
'use client';

import { useEffect, useState } from 'react';
import { fetchOverview, type AnalyticsOverview } from '@/lib/zenovay';

interface Props {
websiteId: string;
range?: string;
}

export function VisitorChart({ websiteId, range = '7d' }: Props) {
const [data, setData] = useState<AnalyticsOverview | null>(null);
const [loading, setLoading] = useState(true);

useEffect(() => {
  fetchOverview(websiteId, range)
    .then(setData)
    .finally(() => setLoading(false));
}, [websiteId, range]);

if (loading) return <div>Loading chart...</div>;
if (!data) return <div>No data available</div>;

const { daily_stats, summary } = data;
const maxViews = Math.max(...daily_stats.map(d => d.page_views));

return (
  <div>
    <div style={{ display: 'flex', gap: '2rem', marginBottom: '1rem' }}>
      <div>
        <strong>{summary.total_visitors.toLocaleString()}</strong>
        <div>Total Visitors</div>
      </div>
      <div>
        <strong>{summary.total_page_views.toLocaleString()}</strong>
        <div>Page Views</div>
      </div>
      <div>
        <strong>{summary.unique_visitors.toLocaleString()}</strong>
        <div>Unique Visitors</div>
      </div>
    </div>

    <div style={{ display: 'flex', alignItems: 'flex-end', gap: '2px', height: '200px' }}>
      {daily_stats.map((day) => (
        <div
          key={day.date}
          title={`${day.date}: ${day.page_views} views`}
          style={{
            flex: 1,
            height: `${(day.page_views / maxViews) * 100}%`,
            backgroundColor: '#3b82f6',
            borderRadius: '2px 2px 0 0',
            minHeight: '2px',
          }}
        />
      ))}
    </div>

    <div style={{ display: 'flex', justifyContent: 'space-between', fontSize: '0.75rem' }}>
      <span>{daily_stats[0]?.date}</span>
      <span>{daily_stats[daily_stats.length - 1]?.date}</span>
    </div>
  </div>
);
}
Mapa Geográfico
Use o endpoint /analytics/:websiteId/countries para exibir locais dos visitantes. A resposta inclui códigos de país que funcionam com qualquer biblioteca de mapa:
'use client';

import { useEffect, useState } from 'react';
import { fetchCountries } from '@/lib/zenovay';

interface Country {
country_code: string;
country_name: string;
visitors: number;
avg_value_score: number;
}

export function CountryTable({ websiteId }: { websiteId: string }) {
const [countries, setCountries] = useState<Country[]>([]);

useEffect(() => {
  fetchCountries(websiteId, '30d').then(setCountries);
}, [websiteId]);

const total = countries.reduce((sum, c) => sum + c.visitors, 0);

return (
  <table style={{ width: '100%', borderCollapse: 'collapse' }}>
    <thead>
      <tr>
        <th style={{ textAlign: 'left' }}>Country</th>
        <th style={{ textAlign: 'right' }}>Visitors</th>
        <th style={{ textAlign: 'right' }}>%</th>
      </tr>
    </thead>
    <tbody>
      {countries.map((country) => (
        <tr key={country.country_code}>
          <td>{country.country_name}</td>
          <td style={{ textAlign: 'right' }}>{country.visitors.toLocaleString()}</td>
          <td style={{ textAlign: 'right' }}>
            {total > 0 ? ((country.visitors / total) * 100).toFixed(1) : 0}%
          </td>
        </tr>
      ))}
    </tbody>
  </table>
);
}
Para um mapa interativo, combine os dados de país com uma biblioteca como react-simple-maps ou Mapbox GL JS. O campo country_code usa códigos ISO 3166-1 alpha-2 que essas bibliotecas entendem diretamente.
Desagregação de Tecnologia
Exiba estatísticas de dispositivo, navegador e SO a partir de /analytics/:websiteId/technology:
'use client';

import { useEffect, useState } from 'react';
import { fetchTechnology } from '@/lib/zenovay';

interface TechItem {
name: string;
count: number;
percentage: number;
}

function BarList({ items, label }: { items: TechItem[]; label: string }) {
return (
  <div>
    <h3>{label}</h3>
    {items.slice(0, 5).map((item) => (
      <div key={item.name} style={{ marginBottom: '0.5rem' }}>
        <div style={{ display: 'flex', justifyContent: 'space-between' }}>
          <span>{item.name}</span>
          <span>{item.percentage}%</span>
        </div>
        <div style={{ background: '#e5e7eb', borderRadius: '4px', height: '8px' }}>
          <div
            style={{
              width: `${item.percentage}%`,
              background: '#3b82f6',
              borderRadius: '4px',
              height: '100%',
            }}
          />
        </div>
      </div>
    ))}
  </div>
);
}

export function TechBreakdown({ websiteId }: { websiteId: string }) {
const [tech, setTech] = useState<{
  devices: TechItem[];
  browsers: TechItem[];
  operating_systems: TechItem[];
} | null>(null);

useEffect(() => {
  fetchTechnology(websiteId).then(setTech);
}, [websiteId]);

if (!tech) return <div>Loading...</div>;

return (
  <div style={{ display: 'grid', gridTemplateColumns: '1fr 1fr 1fr', gap: '2rem' }}>
    <BarList items={tech.devices} label="Devices" />
    <BarList items={tech.browsers} label="Browsers" />
    <BarList items={tech.operating_systems} label="Operating Systems" />
  </div>
);
}
Contagem de Visitantes em Tempo Real
O endpoint de visitante ao vivo é público e não requer autenticação:
GET https://api.zenovay.com/e/live/YOUR_TRACKING_CODE
Isso o torna seguro para chamar diretamente do navegador. Faça polling a cada 10 segundos para um contador ao vivo:
'use client';

import { useEffect, useState } from 'react';

export function LiveVisitors({ trackingCode }: { trackingCode: string }) {
const [count, setCount] = useState<number | null>(null);

useEffect(() => {
  const fetchLive = async () => {
    try {
      const res = await fetch(
        `https://api.zenovay.com/e/live/${trackingCode}`
      );
      const data = await res.json();
      setCount(data.visitors ?? data.data?.visitors ?? 0);
    } catch {
      // Silently fail -- keep last known count
    }
  };

  fetchLive();
  const interval = setInterval(fetchLive, 10_000);
  return () => clearInterval(interval);
}, [trackingCode]);

return (
  <div style={{ display: 'flex', alignItems: 'center', gap: '0.5rem' }}>
    <span
      style={{
        width: '8px',
        height: '8px',
        borderRadius: '50%',
        backgroundColor: count !== null ? '#22c55e' : '#9ca3af',
        display: 'inline-block',
      }}
    />
    <span>
      {count !== null ? count.toLocaleString() : '--'} visitor{count !== 1 ? 's' : ''} online
    </span>
  </div>
);
}
Juntando Tudo
Aqui está uma página completa do dashboard combinando todos os componentes:
import { VisitorChart } from '@/components/VisitorChart';
import { CountryTable } from '@/components/CountryTable';
import { TechBreakdown } from '@/components/TechBreakdown';
import { LiveVisitors } from '@/components/LiveVisitors';

const WEBSITE_ID = 'ws_abc123';         // Your Zenovay website ID
const TRACKING_CODE = 'ZV_XXXXXXXXXXX';  // Your tracking code

export default function DashboardPage() {
return (
  <div style={{ maxWidth: '1200px', margin: '0 auto', padding: '2rem' }}>
    <div style={{ display: 'flex', justifyContent: 'space-between', alignItems: 'center' }}>
      <h1>Analytics Dashboard</h1>
      <LiveVisitors trackingCode={TRACKING_CODE} />
    </div>

    <section style={{ marginTop: '2rem' }}>
      <h2>Visitor Trends</h2>
      <VisitorChart websiteId={WEBSITE_ID} range="30d" />
    </section>

    <section style={{ marginTop: '2rem' }}>
      <h2>Technology</h2>
      <TechBreakdown websiteId={WEBSITE_ID} />
    </section>

    <section style={{ marginTop: '2rem' }}>
      <h2>Top Countries</h2>
      <CountryTable websiteId={WEBSITE_ID} />
    </section>
  </div>
);
}
Próximas Etapas
- Primeiros Passos com a API -- Configuração de chave de API e autenticação
- Análise do Lado do Servidor -- Wrappers Node.js e Python para pipelines de backend
- Webhook e Dados em Tempo Real -- Padrões avançados de polling e alertas
- Referência de API Externa -- Documentação completa de endpoints