Créer un tableau de bord analytique personnalisé
Ce guide vous montre comment créer un tableau de bord analytique personnalisé qui affiche vos données Zenovay. Vous apprendrez l'architecture recommandée, comment proxifier les appels API en toute sécurité, et comment créer des graphiques, des cartes et des compteurs de visiteurs en temps réel.
Conditions préalables
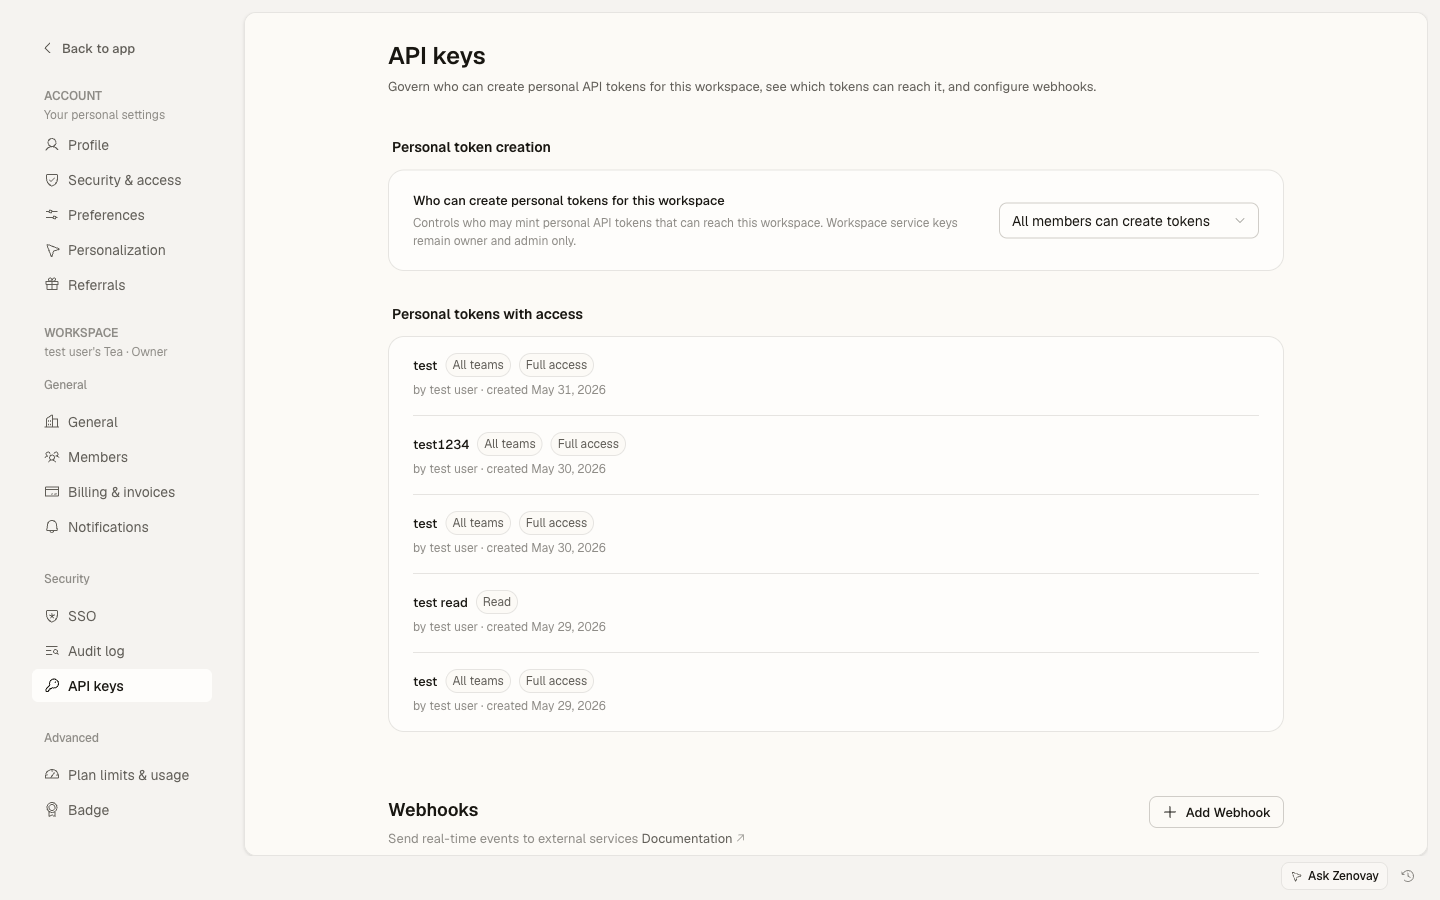
Vous avez besoin d'une clé API Zenovay avant de faire tous les appels API. Allez à Paramètres → Sécurité → Clés API pour en créer une. L'accès à l'API nécessite un plan payant.
Aperçu de l'architecture
Le motif recommandé utilise un proxy côté serveur pour sécuriser votre clé API :
Browser  -->  Your Backend  -->  Zenovay API
                (proxy)          api.zenovay.com
N'exposez jamais votre clé API Zenovay en JavaScript côté client. Proxifiez toujours les requêtes via votre propre serveur.
Configurer un proxy côté serveur
import { NextResponse } from 'next/server';

const ZENOVAY_API_KEY = process.env.ZENOVAY_API_KEY!;
const ZENOVAY_BASE_URL = 'https://api.zenovay.com/api/external/v1';

export async function GET(request: Request) {
const { searchParams } = new URL(request.url);
const websiteId = searchParams.get('websiteId');
const endpoint = searchParams.get('endpoint') || '';
const range = searchParams.get('range') || '7d';

if (!websiteId) {
  return NextResponse.json({ error: 'websiteId required' }, { status: 400 });
}

const url = `${ZENOVAY_BASE_URL}/analytics/${websiteId}${endpoint ? '/' + endpoint : ''}?range=${range}`;

const response = await fetch(url, {
  headers: { 'X-API-Key': ZENOVAY_API_KEY },
});

const data = await response.json();
return NextResponse.json(data);
}
Récupérer les données d'aperçu analytique
Le point de terminaison /analytics/:websiteId retourne des statistiques résumées et des ventilations quotidiennes :
const API_BASE = '/api/analytics'; // Your proxy endpoint

export interface AnalyticsOverview {
website: { id: string; domain: string; name: string };
time_range: string;
summary: {
  total_visitors: number;
  total_page_views: number;
  unique_visitors: number;
};
daily_stats: Array<{
  date: string;
  total_visitors: number;
  page_views: number;
  unique_visitors: number;
}>;
}

export async function fetchOverview(
websiteId: string,
range = '7d'
): Promise<AnalyticsOverview> {
const res = await fetch(
  `${API_BASE}?websiteId=${websiteId}&range=${range}`
);
const json = await res.json();

if (!json.success) throw new Error(json.error?.message || 'API error');
return json.data;
}

export async function fetchCountries(websiteId: string, range = '7d') {
const res = await fetch(
  `${API_BASE}?websiteId=${websiteId}&endpoint=countries&range=${range}`
);
const json = await res.json();
if (!json.success) throw new Error(json.error?.message || 'API error');
return json.data.countries;
}

export async function fetchTechnology(websiteId: string, range = '7d') {
const res = await fetch(
  `${API_BASE}?websiteId=${websiteId}&endpoint=technology&range=${range}`
);
const json = await res.json();
if (!json.success) throw new Error(json.error?.message || 'API error');
return json.data;
}
Créer des graphiques de visiteurs
Utilisez le tableau daily_stats provenant de l'aperçu analytique pour créer des graphiques de séries chronologiques. Voici un exemple utilisant un canvas HTML simple, mais vous pouvez utiliser n'importe quelle bibliothèque de graphiques (Chart.js, Recharts, etc.) :
'use client';

import { useEffect, useState } from 'react';
import { fetchOverview, type AnalyticsOverview } from '@/lib/zenovay';

interface Props {
websiteId: string;
range?: string;
}

export function VisitorChart({ websiteId, range = '7d' }: Props) {
const [data, setData] = useState<AnalyticsOverview | null>(null);
const [loading, setLoading] = useState(true);

useEffect(() => {
  fetchOverview(websiteId, range)
    .then(setData)
    .finally(() => setLoading(false));
}, [websiteId, range]);

if (loading) return <div>Loading chart...</div>;
if (!data) return <div>No data available</div>;

const { daily_stats, summary } = data;
const maxViews = Math.max(...daily_stats.map(d => d.page_views));

return (
  <div>
    <div style={{ display: 'flex', gap: '2rem', marginBottom: '1rem' }}>
      <div>
        <strong>{summary.total_visitors.toLocaleString()}</strong>
        <div>Total Visitors</div>
      </div>
      <div>
        <strong>{summary.total_page_views.toLocaleString()}</strong>
        <div>Page Views</div>
      </div>
      <div>
        <strong>{summary.unique_visitors.toLocaleString()}</strong>
        <div>Unique Visitors</div>
      </div>
    </div>

    <div style={{ display: 'flex', alignItems: 'flex-end', gap: '2px', height: '200px' }}>
      {daily_stats.map((day) => (
        <div
          key={day.date}
          title={`${day.date}: ${day.page_views} views`}
          style={{
            flex: 1,
            height: `${(day.page_views / maxViews) * 100}%`,
            backgroundColor: '#3b82f6',
            borderRadius: '2px 2px 0 0',
            minHeight: '2px',
          }}
        />
      ))}
    </div>

    <div style={{ display: 'flex', justifyContent: 'space-between', fontSize: '0.75rem' }}>
      <span>{daily_stats[0]?.date}</span>
      <span>{daily_stats[daily_stats.length - 1]?.date}</span>
    </div>
  </div>
);
}
Carte géographique
Utilisez le point de terminaison /analytics/:websiteId/countries pour afficher les emplacements des visiteurs. La réponse inclut des codes pays qui fonctionnent avec n'importe quelle bibliothèque cartographique :
'use client';

import { useEffect, useState } from 'react';
import { fetchCountries } from '@/lib/zenovay';

interface Country {
country_code: string;
country_name: string;
visitors: number;
avg_value_score: number;
}

export function CountryTable({ websiteId }: { websiteId: string }) {
const [countries, setCountries] = useState<Country[]>([]);

useEffect(() => {
  fetchCountries(websiteId, '30d').then(setCountries);
}, [websiteId]);

const total = countries.reduce((sum, c) => sum + c.visitors, 0);

return (
  <table style={{ width: '100%', borderCollapse: 'collapse' }}>
    <thead>
      <tr>
        <th style={{ textAlign: 'left' }}>Country</th>
        <th style={{ textAlign: 'right' }}>Visitors</th>
        <th style={{ textAlign: 'right' }}>%</th>
      </tr>
    </thead>
    <tbody>
      {countries.map((country) => (
        <tr key={country.country_code}>
          <td>{country.country_name}</td>
          <td style={{ textAlign: 'right' }}>{country.visitors.toLocaleString()}</td>
          <td style={{ textAlign: 'right' }}>
            {total > 0 ? ((country.visitors / total) * 100).toFixed(1) : 0}%
          </td>
        </tr>
      ))}
    </tbody>
  </table>
);
}
Pour une carte interactive, associez les données de pays avec une bibliothèque comme react-simple-maps ou Mapbox GL JS. Le champ country_code utilise les codes ISO 3166-1 alpha-2 que ces bibliothèques comprennent directement.
Ventilation technologique
Affichez les statistiques des appareils, navigateurs et systèmes d'exploitation du point de terminaison /analytics/:websiteId/technology :
'use client';

import { useEffect, useState } from 'react';
import { fetchTechnology } from '@/lib/zenovay';

interface TechItem {
name: string;
count: number;
percentage: number;
}

function BarList({ items, label }: { items: TechItem[]; label: string }) {
return (
  <div>
    <h3>{label}</h3>
    {items.slice(0, 5).map((item) => (
      <div key={item.name} style={{ marginBottom: '0.5rem' }}>
        <div style={{ display: 'flex', justifyContent: 'space-between' }}>
          <span>{item.name}</span>
          <span>{item.percentage}%</span>
        </div>
        <div style={{ background: '#e5e7eb', borderRadius: '4px', height: '8px' }}>
          <div
            style={{
              width: `${item.percentage}%`,
              background: '#3b82f6',
              borderRadius: '4px',
              height: '100%',
            }}
          />
        </div>
      </div>
    ))}
  </div>
);
}

export function TechBreakdown({ websiteId }: { websiteId: string }) {
const [tech, setTech] = useState<{
  devices: TechItem[];
  browsers: TechItem[];
  operating_systems: TechItem[];
} | null>(null);

useEffect(() => {
  fetchTechnology(websiteId).then(setTech);
}, [websiteId]);

if (!tech) return <div>Loading...</div>;

return (
  <div style={{ display: 'grid', gridTemplateColumns: '1fr 1fr 1fr', gap: '2rem' }}>
    <BarList items={tech.devices} label="Devices" />
    <BarList items={tech.browsers} label="Browsers" />
    <BarList items={tech.operating_systems} label="Operating Systems" />
  </div>
);
}
Compteur de visiteurs en temps réel
Le point de terminaison des visiteurs en direct est public et ne nécessite pas d'authentification :
GET https://api.zenovay.com/e/live/YOUR_TRACKING_CODE
Cela le rend sûr d'appeler directement depuis le navigateur. Interrogez toutes les 10 secondes pour un compteur en direct :
'use client';

import { useEffect, useState } from 'react';

export function LiveVisitors({ trackingCode }: { trackingCode: string }) {
const [count, setCount] = useState<number | null>(null);

useEffect(() => {
  const fetchLive = async () => {
    try {
      const res = await fetch(
        `https://api.zenovay.com/e/live/${trackingCode}`
      );
      const data = await res.json();
      setCount(data.visitors ?? data.data?.visitors ?? 0);
    } catch {
      // Silently fail -- keep last known count
    }
  };

  fetchLive();
  const interval = setInterval(fetchLive, 10_000);
  return () => clearInterval(interval);
}, [trackingCode]);

return (
  <div style={{ display: 'flex', alignItems: 'center', gap: '0.5rem' }}>
    <span
      style={{
        width: '8px',
        height: '8px',
        borderRadius: '50%',
        backgroundColor: count !== null ? '#22c55e' : '#9ca3af',
        display: 'inline-block',
      }}
    />
    <span>
      {count !== null ? count.toLocaleString() : '--'} visitor{count !== 1 ? 's' : ''} online
    </span>
  </div>
);
}
Assembler le tout
Voici une page de tableau de bord complète combinant tous les composants :
import { VisitorChart } from '@/components/VisitorChart';
import { CountryTable } from '@/components/CountryTable';
import { TechBreakdown } from '@/components/TechBreakdown';
import { LiveVisitors } from '@/components/LiveVisitors';

const WEBSITE_ID = 'ws_abc123';         // Your Zenovay website ID
const TRACKING_CODE = 'ZV_XXXXXXXXXXX';  // Your tracking code

export default function DashboardPage() {
return (
  <div style={{ maxWidth: '1200px', margin: '0 auto', padding: '2rem' }}>
    <div style={{ display: 'flex', justifyContent: 'space-between', alignItems: 'center' }}>
      <h1>Analytics Dashboard</h1>
      <LiveVisitors trackingCode={TRACKING_CODE} />
    </div>

    <section style={{ marginTop: '2rem' }}>
      <h2>Visitor Trends</h2>
      <VisitorChart websiteId={WEBSITE_ID} range="30d" />
    </section>

    <section style={{ marginTop: '2rem' }}>
      <h2>Technology</h2>
      <TechBreakdown websiteId={WEBSITE_ID} />
    </section>

    <section style={{ marginTop: '2rem' }}>
      <h2>Top Countries</h2>
      <CountryTable websiteId={WEBSITE_ID} />
    </section>
  </div>
);
}
Étapes suivantes
- Premiers pas avec l'API -- Configuration des clés API et authentification
- Analyse côté serveur -- Enveloppes Node.js et Python pour les pipelines de back-end
- Webhook et données en temps réel -- Motifs d'interrogation et d'alertes avancés
- Référence API externe -- Documentation complète des points de terminaison