Changelog

Stay up to date with all the latest changes to Zenovay.

Replays show your site's own fonts and videos

Session replays now load the web fonts and videos of the recorded page, so a replay looks like the page your visitor saw. Until now the dashboard blocked them, and replays fell back to system fonts with empty video areas.

  • Fonts and videos in replays. Fonts and videos from any HTTPS domain your site uses now load in the replay player
  • Heatmaps ignore query strings. A page's heatmap screenshots are stored under its path without the query string or #fragment, so /pricing?utm_source=x and /pricing share one heatmap
  • API playground in your language for screen readers. While a request is sent, screen readers now announce it in the language of the docs instead of always in English
Heatmaps you set up in three steps

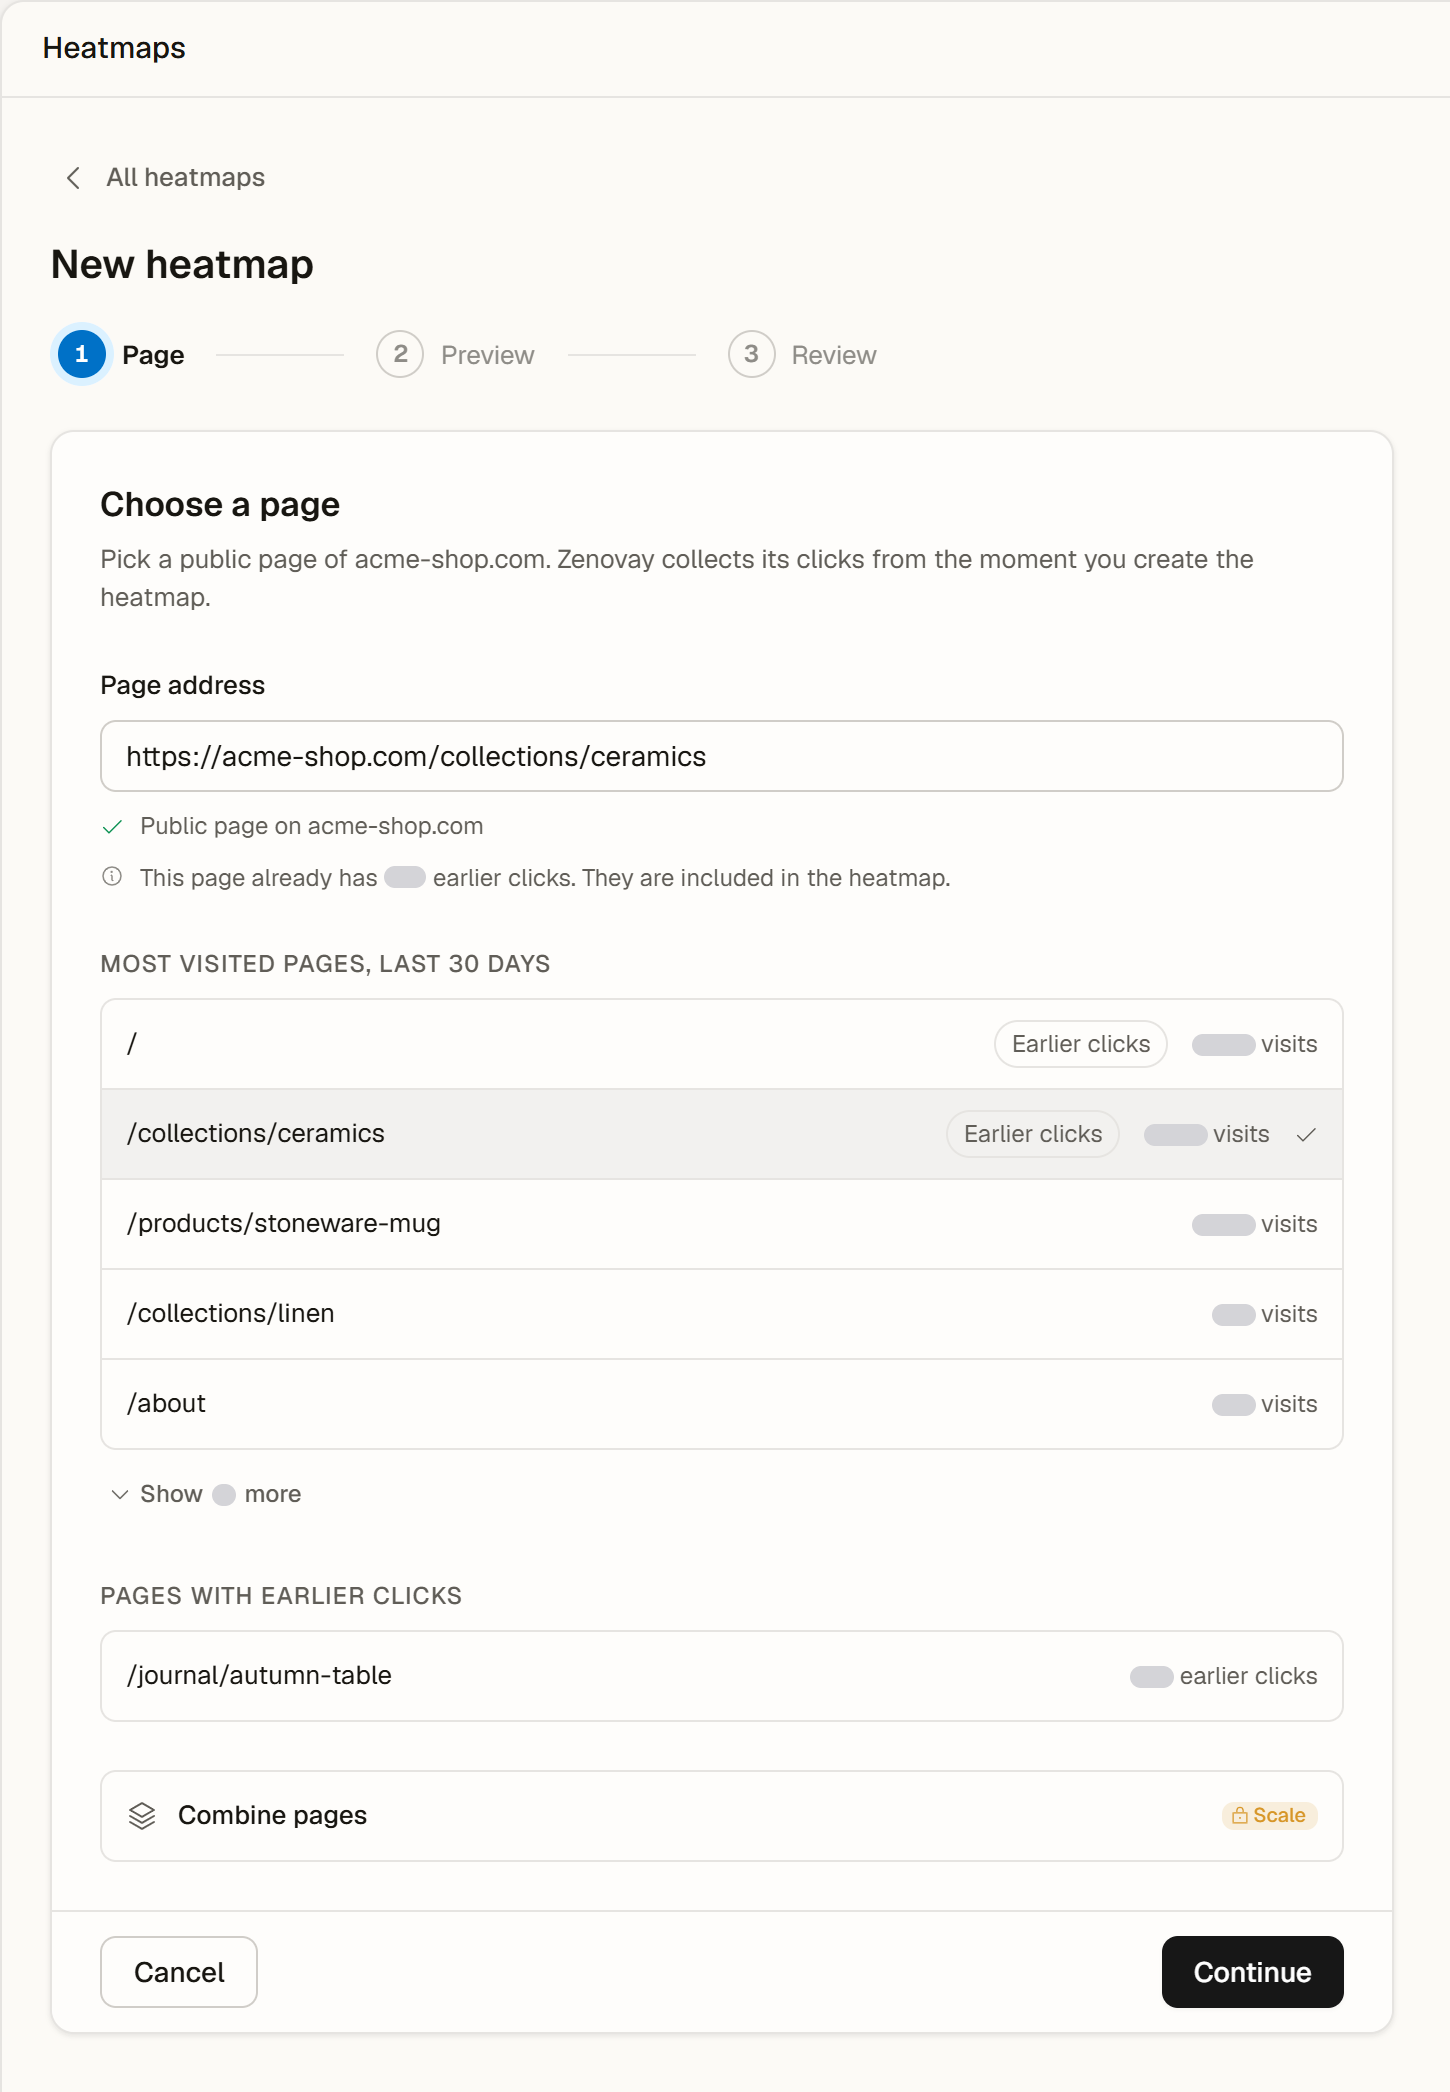
Choose the pages that matter to you and set up a heatmap for each one in three steps. Every plan now includes heatmaps, starting with one on Free.

  • Three steps. Page with suggestions from your most visited pages and from pages with earlier clicks, Preview with a full-page snapshot, and Review. Zenovay collects the page's clicks from the moment you create the heatmap
  • Your heatmaps at a glance. A list with the clicks of the last 30 days and the snapshot of each heatmap, with Rename, Archive and Delete in its ... menu. Archiving frees a slot and keeps the data
  • One snapshot per page and device. Desktop, tablet and phone each get a full-page snapshot that is used for 30 days (14 on Enterprise) and renewed when you open the heatmap after that
  • Refresh page after a redesign. Takes a new snapshot of the device you are viewing right away: 20 refreshes per website and month on Pro, 100 on Scale and 300 on Enterprise
  • Combine pages (Scale and Enterprise). One heatmap for every page that matches a pattern such as /blog/*, shown on the snapshot of a page you choose
  • Heatmaps on every plan. Free includes 1 heatmap per website on desktop with 30 days of history, Pro 10 with tablet and phone and 60 days, Scale 50 with 120 days, and Enterprise unlimited within fair use with 180 days. After a downgrade nothing is deleted: extra heatmaps stay readable
  • Public pages. Heatmaps work on pages that open without a login

Step 1 of a new heatmap: the page address with its check, the most visited pages of the last 30 days, pages with earlier clicks and Combine pages

A new proxy key waits for your proxy

A new proxy key now takes effect only after your proxy has sent it once, so turning it on never costs you data.

  • Create the key, add it to your proxy, done. Until the first request with the key arrives, requests without it are handled as before.
  • Domain settings shows the key as waiting for your proxy until then. A replaced key stays in effect: the old one stops working immediately.
  • zenovay init 1.0.38 creates the key for you when it sets up a Cloudflare Pages proxy, shows it once with the exact place to add it in Cloudflare, and can store it for you if wrangler is logged in.
  • Domain settings now shows when your proxy last sent the key, and warns if requests without it start arriving, so a lost ZENOVAY_PROXY_KEY does not go unnoticed.

Proxy key for self-hosted proxies

If you run your own first-party proxy, you can now protect the visitor IP it forwards with a proxy key.

  • Create the key under Domain settings > General > First-party proxy key. It starts with zvpk_ and is shown only once.
  • Send it in the X-Zenovay-Proxy-Key header on every forwarded request. With a valid key, Zenovay trusts the visitor IP your proxy forwards.
  • Once a site has a key, requests through /fp without it (or with a wrong one) can no longer set the visitor IP. Sites without a key behave as before.
  • You can replace the key (the old one stops working immediately) or remove it in the same place. The CNAME setup and the plain script tag do not need a key.

Heatmaps show the latest page image

On pages with more than ten captured page images, the heatmap could show an older capture instead of the newest one. It now always shows the latest capture, and picking a specific date in the capture list shows that day's image.

More accurate Core Web Vitals

A page opened in a background tab can report a load time of minutes or even hours, because its timer starts when the tab opens, not when someone looks at it. Those readings no longer count.

  • LCP, FCP, TTFB and INP values above 60 seconds are now discarded when they arrive, together with their rating.
  • Readings like this that were already stored have been removed, so the p75 of affected pages now reflects what visitors actually experienced.
  • The tracking script (version 2.1.4) now ignores paints that happen after a tab was hidden, so background tabs no longer send these readings in the first place.

Backup status page

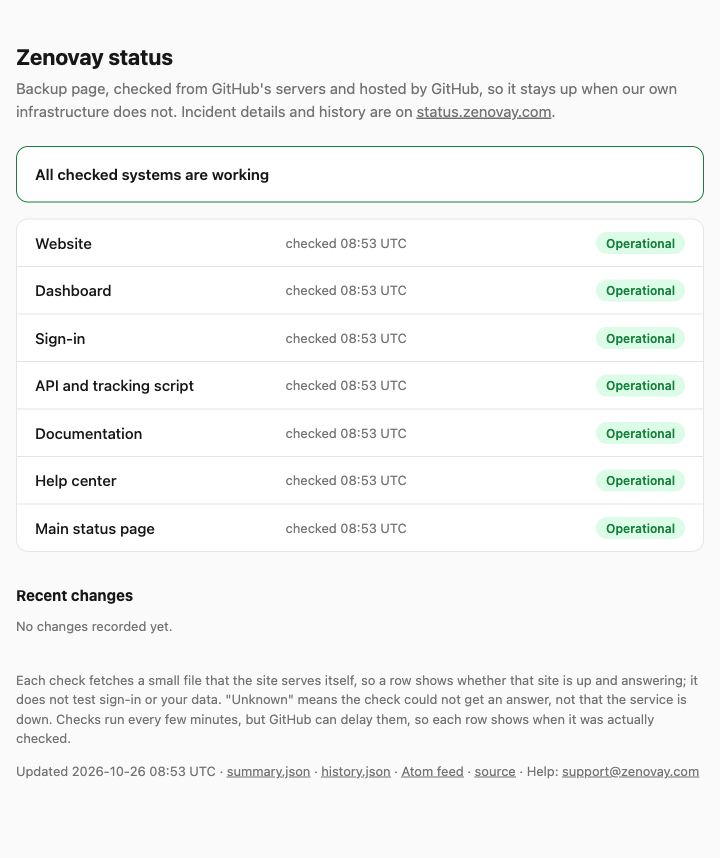
If status.zenovay.com itself does not load, a backup status page at zenovay.github.io/status shows whether each Zenovay site is up.

  • It is checked from GitHub's servers and hosted by GitHub, so it keeps working when our own infrastructure does not.
  • Each row shows when it was last checked, and state changes are published as an Atom feed.
  • The main status page and the help center link to it.

The backup status page listing each Zenovay site as operational

Faster Funnels overview

The Funnels overview in Journeys now calculates every funnel and both comparison periods together, so it loads noticeably faster, also with filters or a segment applied.

Faster dashboard loading

Dashboard cards now wait less before they show your numbers.

  • Each card checks your access to the website with fewer, parallel lookups, and repeated checks within a few seconds reuse the answer.
  • The page checks your login once per load instead of several times.

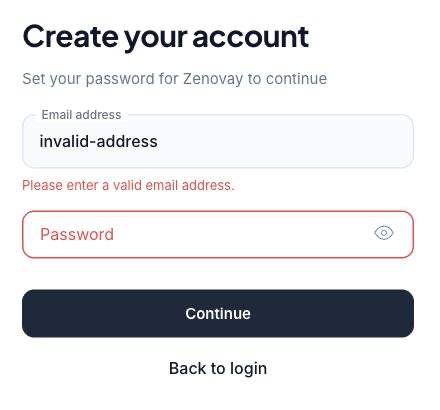
Clearer email validation during signup

Invalid email addresses now get a clear correction prompt on the password step.

  • The password step checks the email format before submitting a sign-in or sign-up request.
  • An email-format rejection from the authentication service now asks you to correct the address, instead of showing a generic account-creation error.

The signup password step showing a clear correction prompt for a malformed email address

SQL Playground, CLI queries and chart chat now run on ClickHouse

Queries on your analytics tables (visitors, page views, events, goals, performance, uptime and the daily rollups) in the SQL Playground, the CLI query command and the charts in the AI chat now run on ClickHouse, a database built for analytics. Other tables, such as payments, still run on PostgreSQL.

  • Your saved queries keep working. Common PostgreSQL syntax runs unchanged: INTERVAL '7 days', ::date, COUNT(*) FILTER (WHERE ...), DATE_TRUNC, ILIKE, HAVING and window functions. A cast to numeric keeps its decimals
  • Same results, same format. Timestamps come back as before, for example 2026-10-25T13:50:31.751+00:00
  • Templates and the AI SQL assistant write ClickHouse SQL for these tables, so you can also use functions such as countIf, uniqExact, toStartOfDay and dateDiff
  • One difference: a value exactly halfway between two numbers rounds to the even one, so ROUND(2.5) returns 2

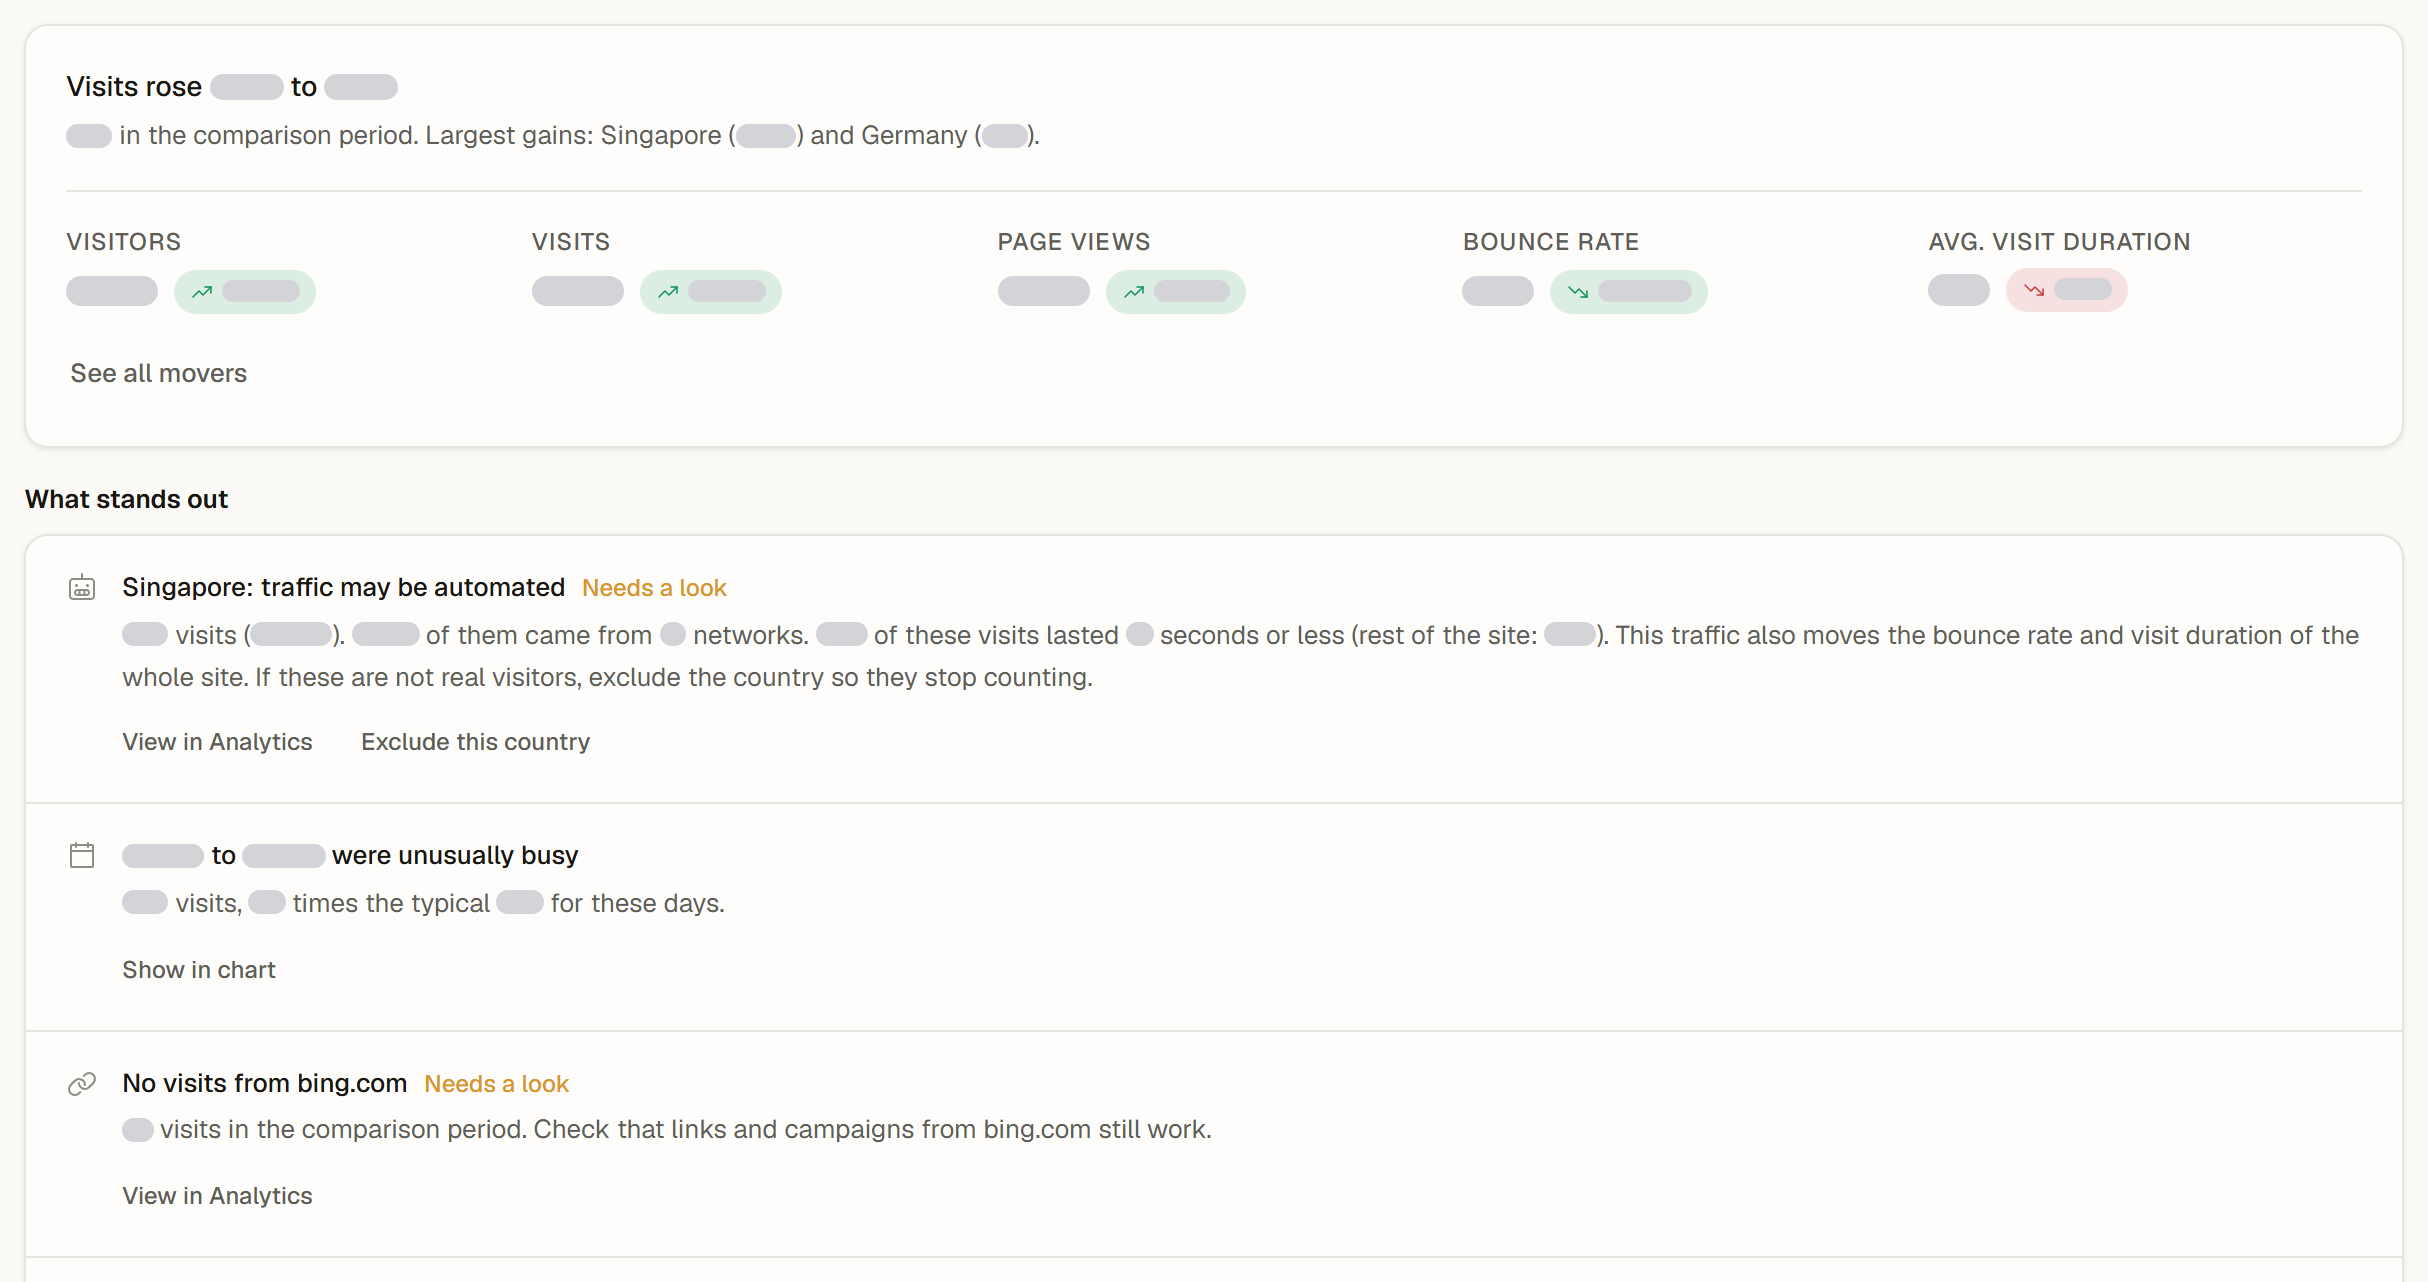
AI insights and Top movers, Performance tips for your AI assistant and a focus mode for Flows

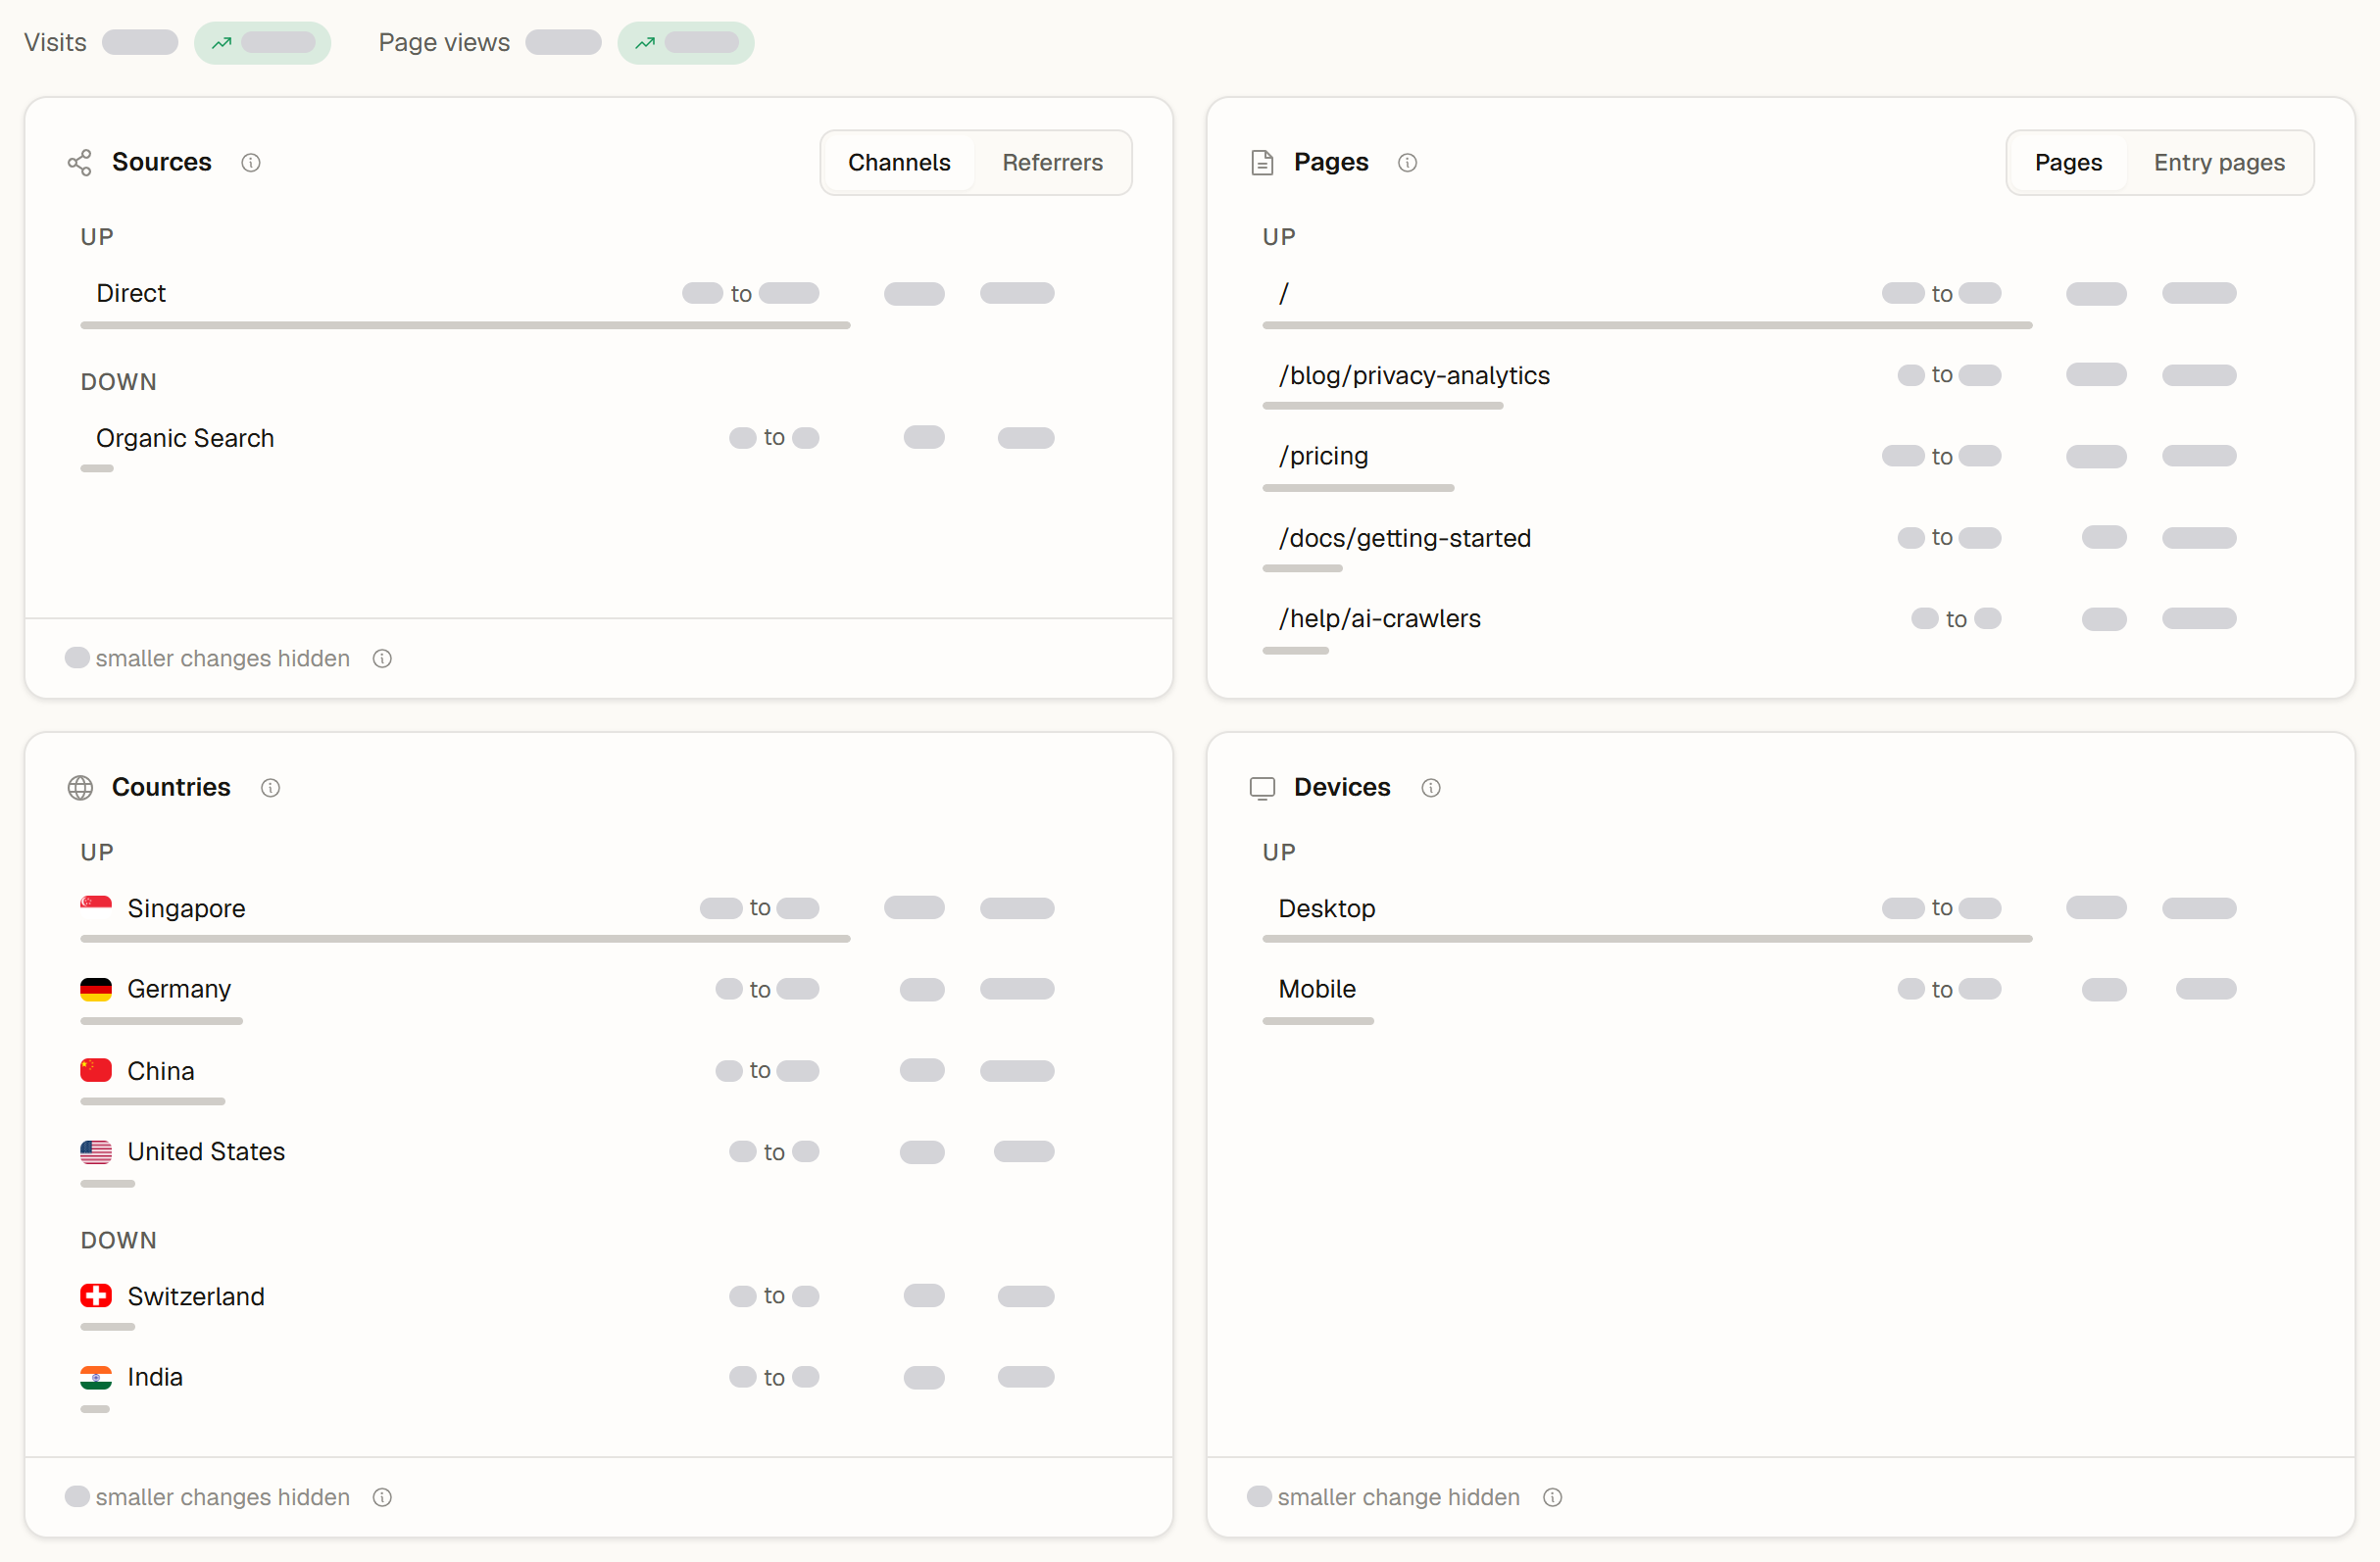
AI insights open with a short briefing on what changed, and Top movers shows which sources, pages, countries and devices moved. Performance, Retention and Uptime explain every figure, Flows focuses on one part of the journey with a click, and the main chart shows any goal line with one click.

  • Goal lines with one click. When a goal line belongs to another metric or interval, a hint under the chart names what it needs, and Show switches the chart to it, on the Analytics chart and in every insight
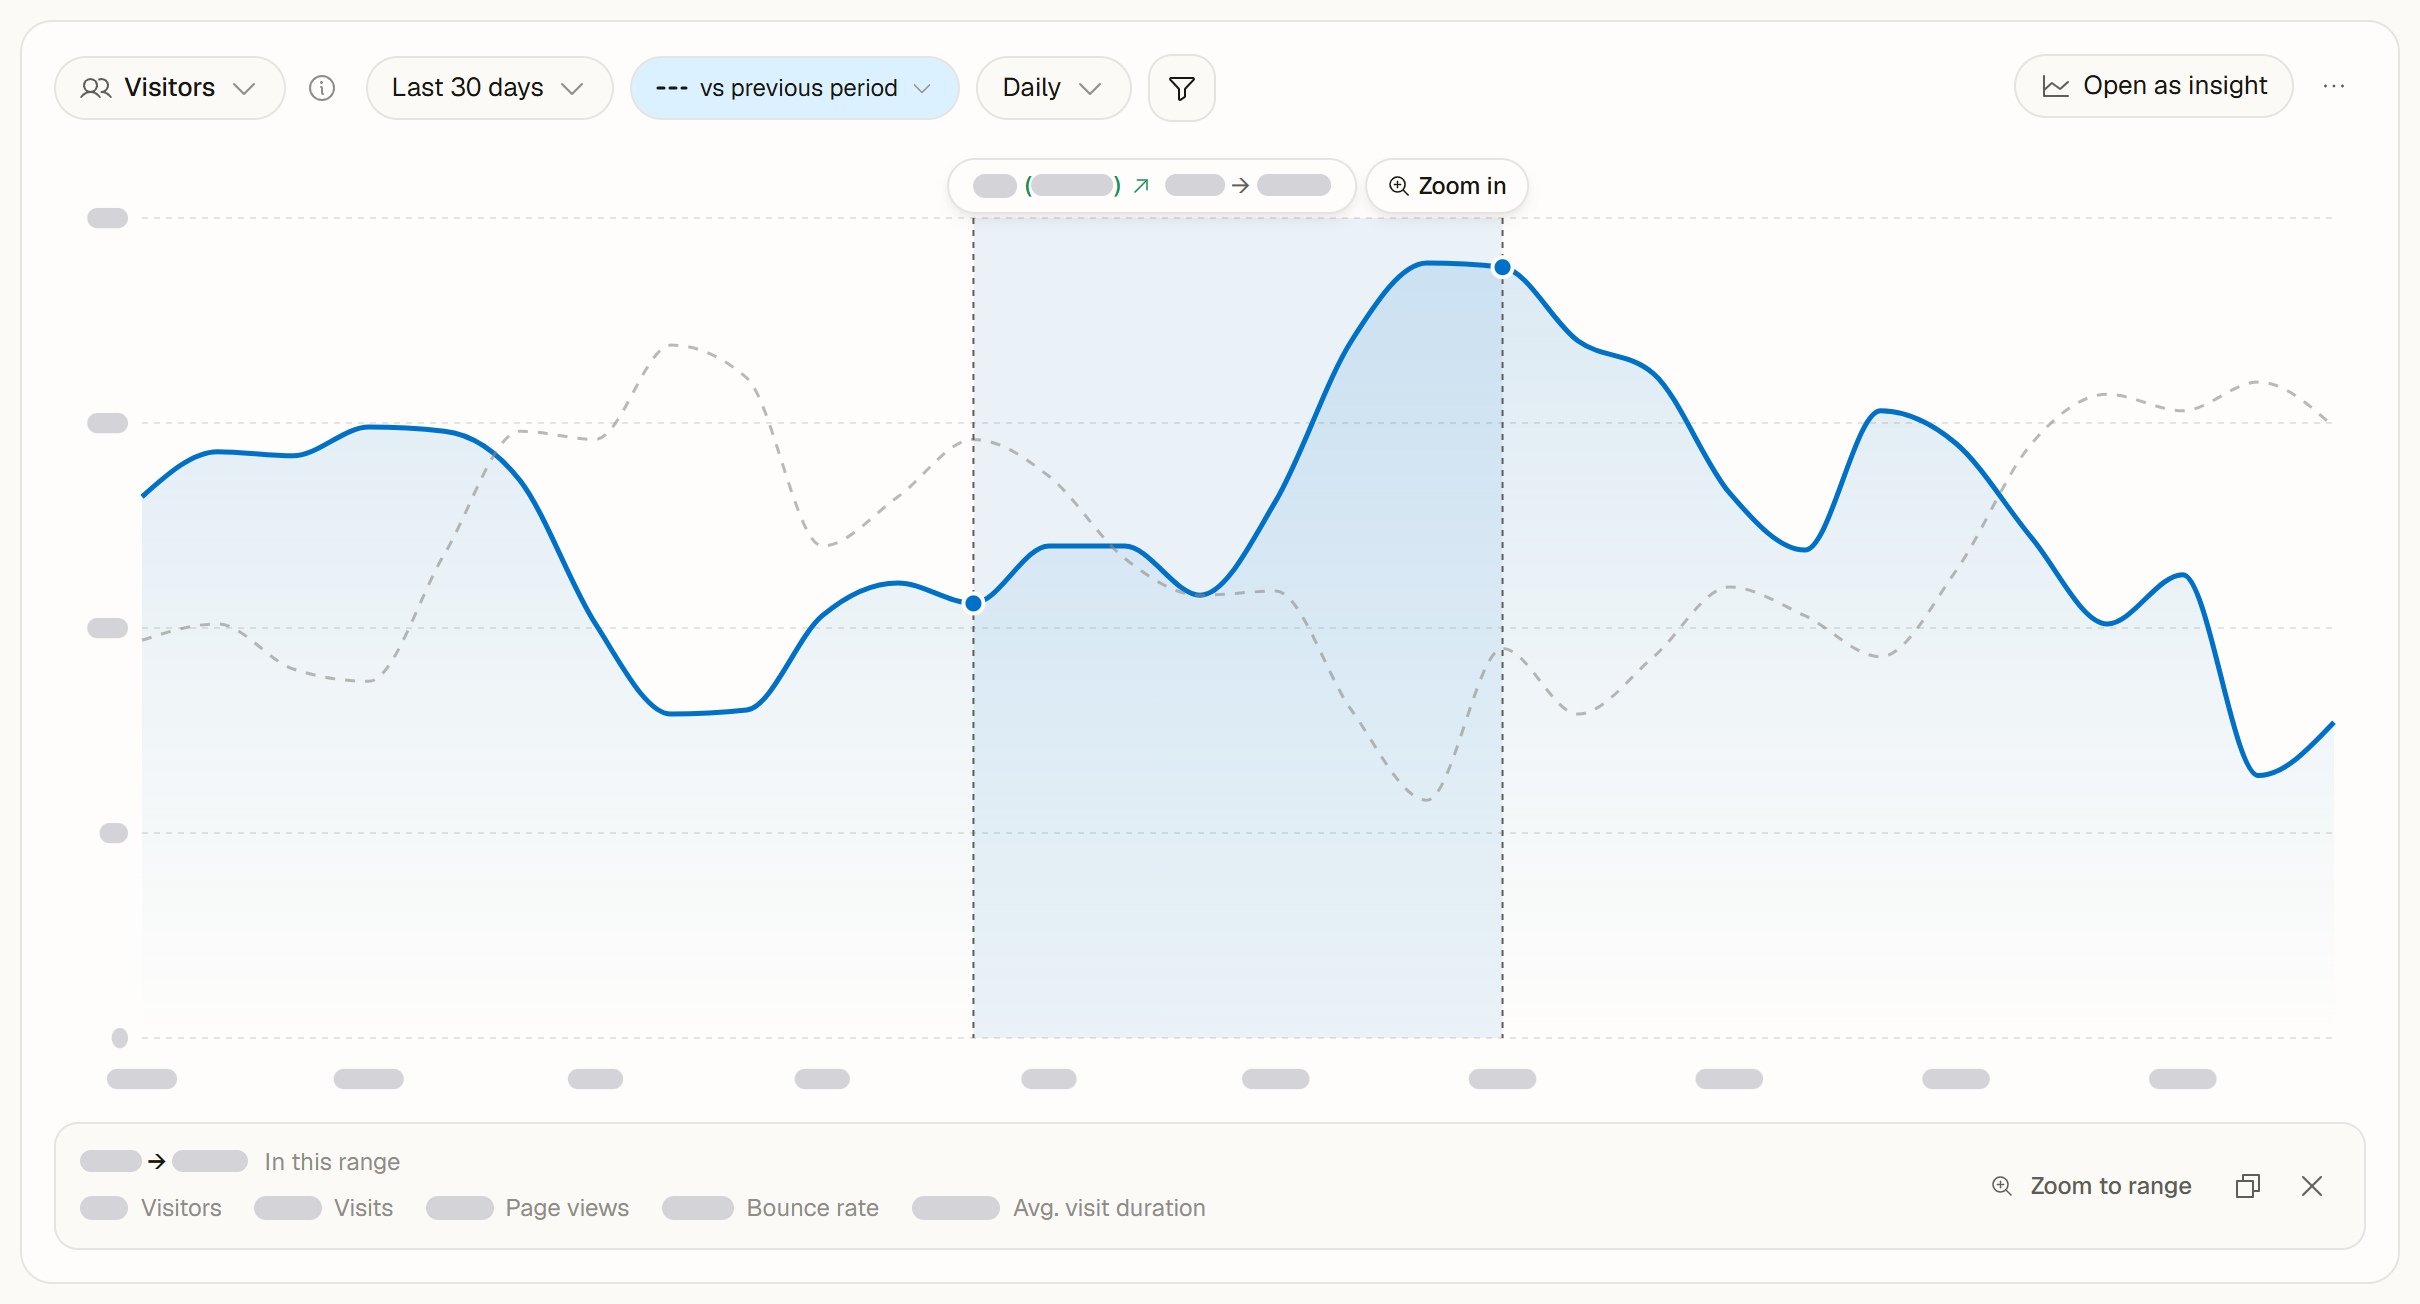
  • Zoom in. Next to a selected range, Zoom in shows just those days, also on hourly charts. Back to and the browser's Back button return to your previous view
  • Share card with your metrics. Choose the metric of the Headline number and the three metrics of the Period summary from Visitors, Visits, Page views, Bounce rate and Avg. visit duration, use the period of your chart with Current view, and download or copy the image
  • X. Traffic from x.com, t.co and twitter.com is labelled X, with the X logo, in sources, campaigns, revenue by source and visitor timelines
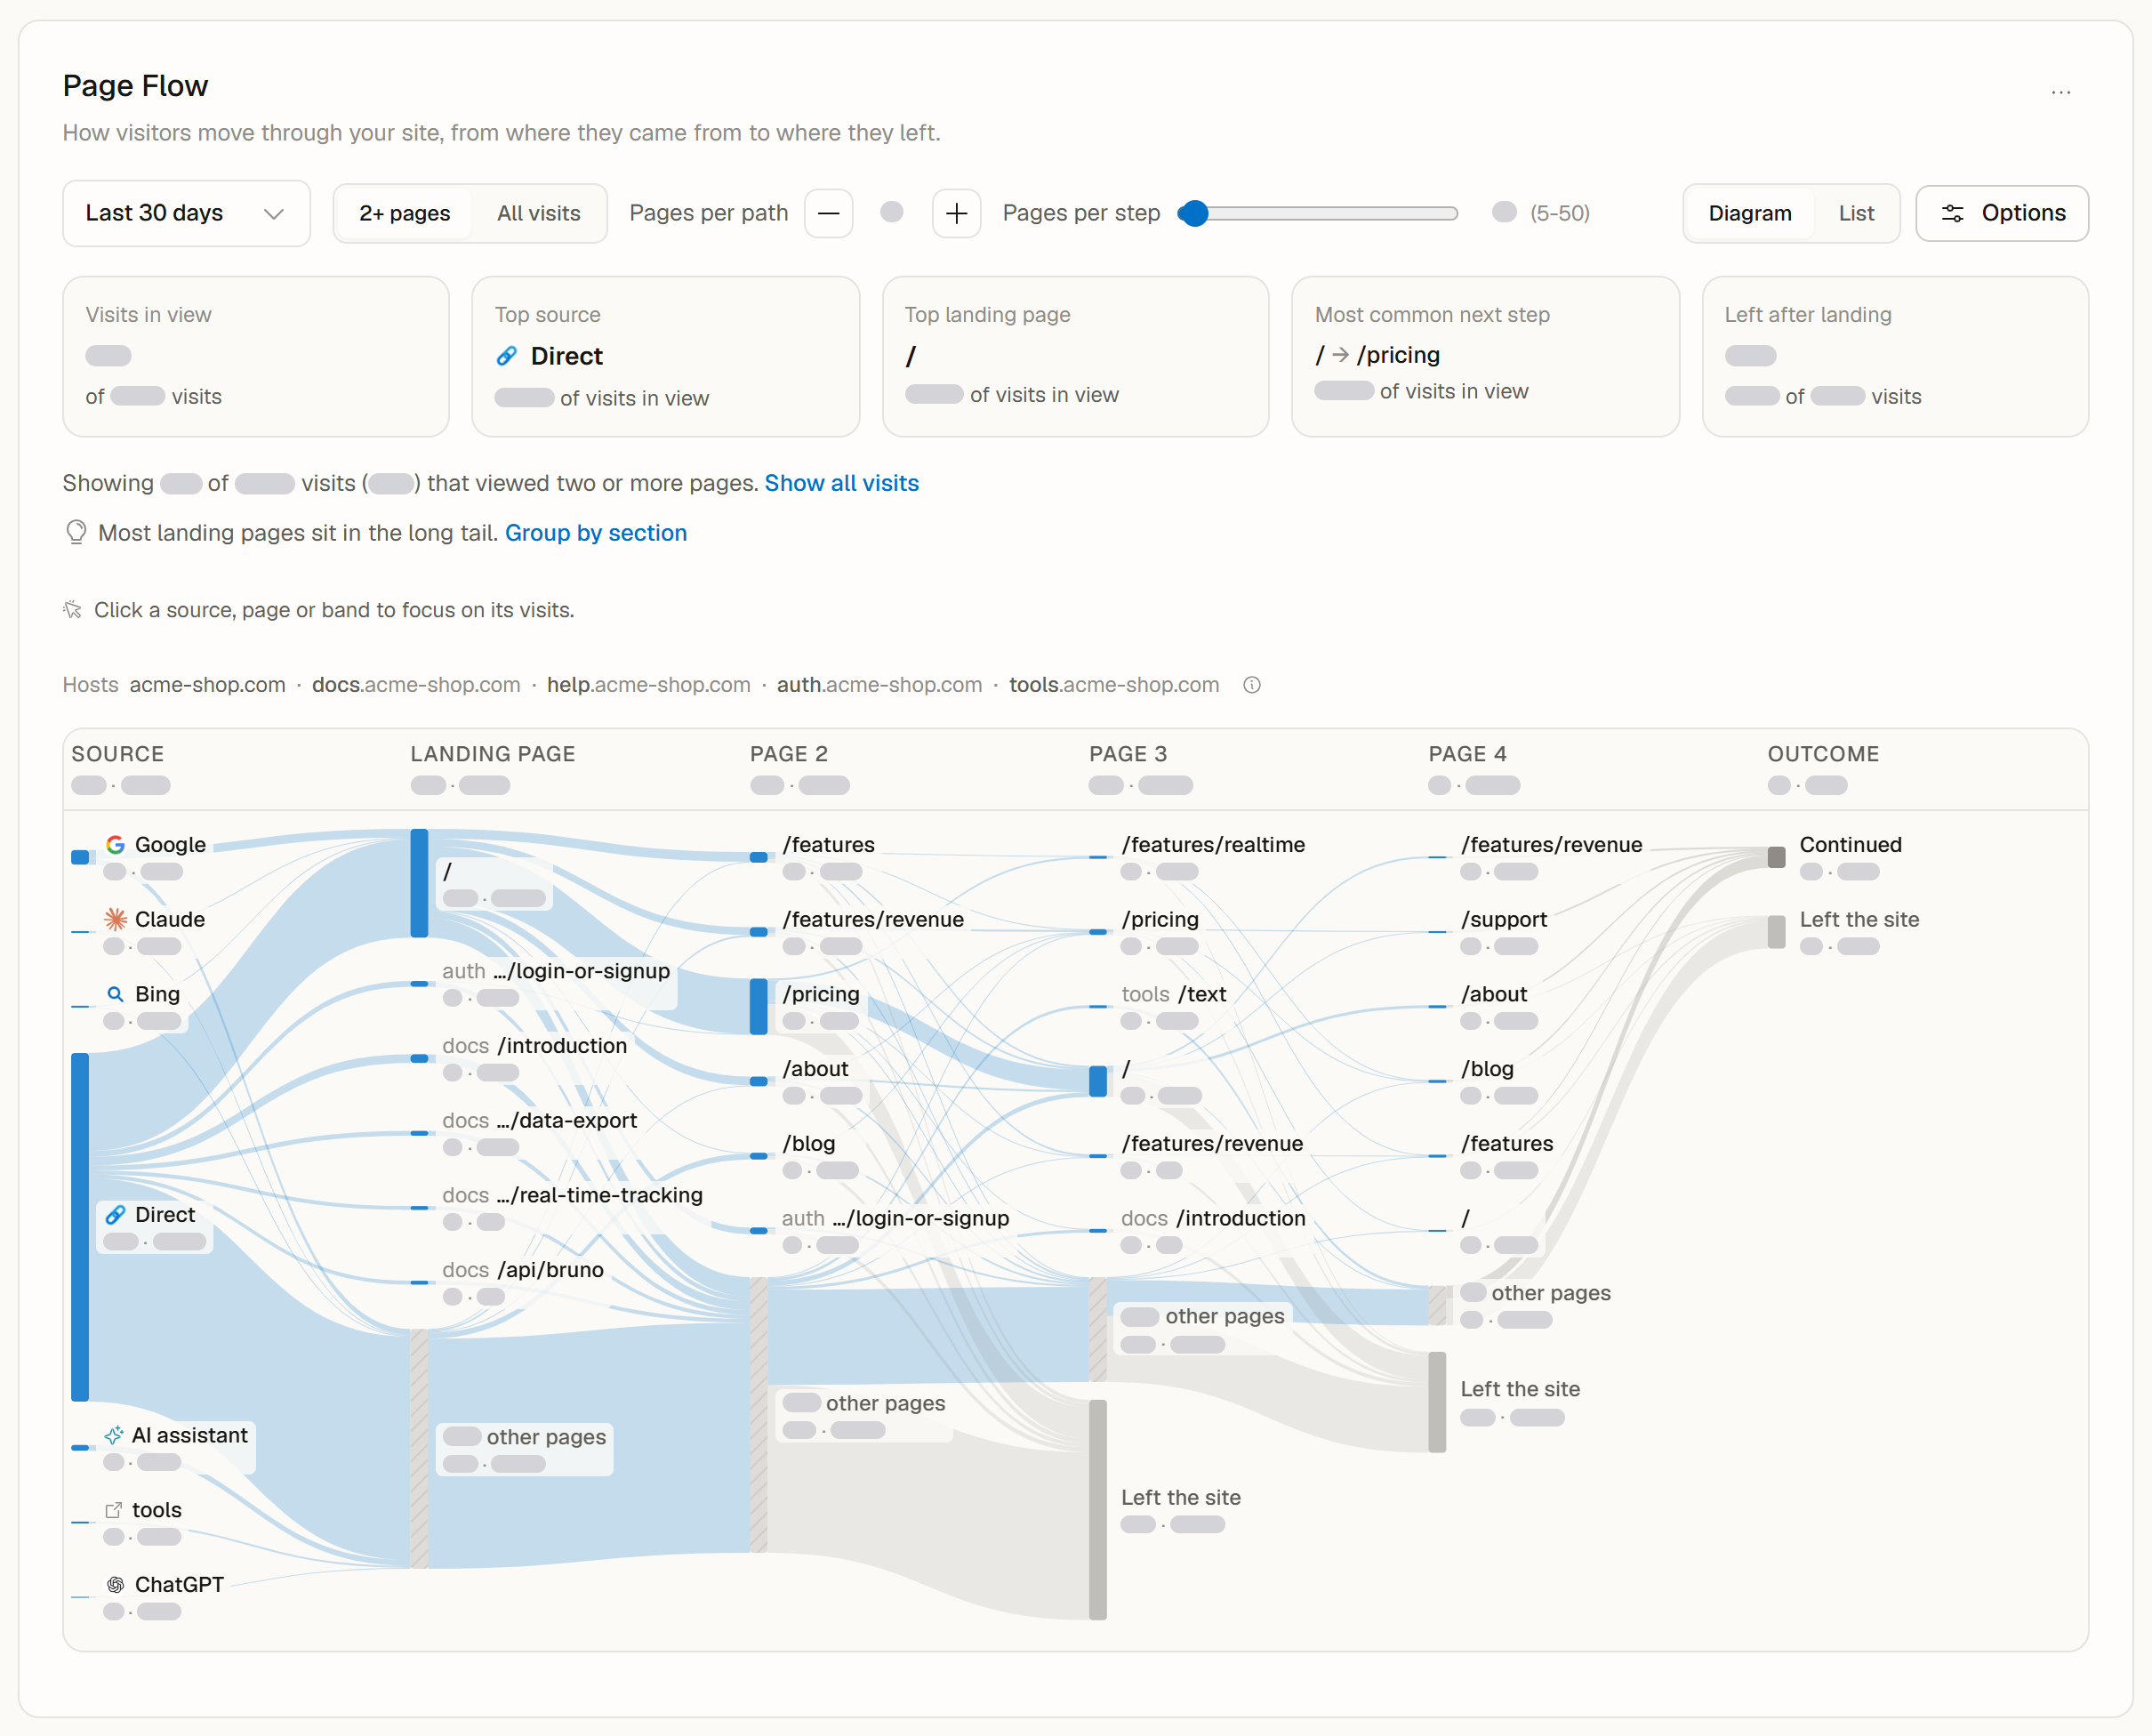
  • Flows focus. Click a source, page or band to focus on its visits, drawn larger with a smooth transition. Narrow it down step by step and go back with the bar above the diagram, Esc or the browser's Back button
  • Performance explained, with suggestions. Every Core Web Vital and the percentile have an explanation, each tile shows its page loads and ratings, and Desktop and mobile compares device types. How to improve names the pages to look at first with concrete tips, and Copy prompt with these numbers prepares a request for your AI assistant, connected through the Zenovay MCP server. Ratings follow the measured values, and page loads from local development stay out of the numbers
  • Retention and Uptime explained. Info icons explain every figure. Retention cohorts count new visitors in your time zone, with return rates weighted by cohort size and lifetime value per new visitor. Uptime shows availability, downtime and incidents for the range you choose, from the last 24 hours to 90 days, with the incident history and the SSL grade on Pro and above
  • AI insights and Top movers (Pro and above). AI insights sum up what changed with numbers, list up to five findings with a next step each and prepare a question for the assistant with Ask about this. Top movers shows the sources, pages, countries and devices that gained or lost the most visits, leaves out normal variation and filters the dashboard with one click
  • Live View: the pages of each visit (Pro and above). The visitor panel lists every page of the visit with the time spent on it, keeps counting on the current page and opens the visitor's full journey. The overlay follows the visitor to every new page and keeps the previous preview, dimmed, while the next one loads. The preview shows exactly the page the visitor is on, and the cursor appears within about 20 seconds after you open the overlay
  • Heatmaps by page (Pro and above). Addresses that differ only in their query string count as one page, each with its real number of clicks. Page snapshots are taken on demand for Desktop, Tablet and Phone, each click is placed on the element that was clicked, and busy sites record clicks from a sample of visits. Zoom, pan, open the map full screen and reset exactly one page after a redesign. Heatmaps stay viewable while paused, pages with clicks get a fresh snapshot on demand, earlier clicks stay one click away next to the precise ones, and the scroll map reads well before a snapshot exists
  • Connect revenue. Without a payment provider, the Revenue tab offers Connect Stripe in one click to owners and admins, and a short note above the charts shows the state of the connection
  • Errors at a glance. The Errors tab shows what needs attention in the selected period: a summary sentence, four tiles, readable titles, noise from bots, browser extensions and other sites set aside with its reasons, and details with failing URLs and the visitor's actions. Change the status of up to 25 errors at once
  • Incidents in one feed. Site-down incidents, error spikes, new errors and conversion drops in one list, with a strip of days, filters, details with evidence, and AI observations in a section of their own

AI insights: a briefing on what changed with five metrics, followed by the findings that stand out, each with a next step

Top movers: the sources, pages, countries and devices that gained or lost the most visits between two periods

Explore the main chart, save insights and export your reports

The Analytics chart now shows any of five metrics and compares it with the previous period or an earlier one. On Pro and above, you open it as an insight, draw goal lines and download your reports as CSV or Excel. Flows now starts where each visit came from, the Users list sorts by every column, Demographics names every language, and the sidebar keeps your favorites on top.

  • Five metrics on the main chart. Visitors, Visits, Page views, Bounce rate and Avg. visit duration, each explained in the info icon, including how sites without cookies count them. Click a tile above the chart to show its metric. The interval that is still running, such as today, shows its value so far with So far in the tooltip, and dashes always mean the comparison
  • Compare with an earlier period. Choose the previous period, or the same period up to 3,650 days, 520 weeks, 120 months or 10 years earlier, aligned point by point in your time zone. An earlier period lies within your plan's report window: Free 30 days, Pro 1 year, Scale 4 years, Enterprise all retained data
  • Measure a range. Drag across the chart (on touch, press and hold first; on a keyboard, Shift with the arrow keys) to read the change between two points and the exact totals of the range, then zoom to it or copy it
  • Open as insight (Pro and above). Show up to five metrics together with their own filters and segment, as a line, area, bar or number, with moving average, running totals and detailed results per period. Save insights for your team, up to 200 per website: owners, admins and editors save them, and everyone on the team can open them. The tab with AI-written analysis is called AI Insights
  • Goal lines (Pro and above). Draw a target such as 500 visitors per day on the chart and in every insight, up to 10 per website, shared with your team. The label is a solid tag on the line, placed where it leaves your data visible
  • CSV and Excel export (Pro and above). The chart, insights, the cards of the Analytics tab, Demographics, Journeys, Retention, Revenue, Errors, Sessions, Downloads and the site list on Home download as CSV or Excel, with the period and filters you see and an About sheet in Excel. On the Free plan, the export items show a lock and Pro. The download of your own personal data (GDPR Art. 20) stays free on every plan
  • Flows from source to exit. The diagram starts with the source of each visit, such as Google, a newsletter or an AI assistant, then shows the landing page, every next page and how the visit ended. Every band uses one scale, hovering a page highlights every full path through it, and the list view follows visits step by step. Page names read calmly: pages on your main host show just their path, other hosts a short prefix, long paths keep their end, and each step lists 6 pages by default
  • The Users list, arranged your way. Sort by any column across the whole list, show, hide and reorder columns (saved to your account), and export the current view: owners, admins and editors, up to 10,000 people on Pro, 50,000 on Scale and 100,000 on Enterprise. Blur names and emails in its menu masks people everywhere at once for screenshots, while exports keep the full data
  • Demographics in plain language. Languages by name, for example Chinese or English (United Kingdom), locations by country, region and city, language by country, the local time of visits and time zones grouped by name
  • Favorites in the sidebar. Star any tab to pin it at the top, up to 10 per workspace, and arrange the sidebar in place with the pencil: drag, show or hide, reset

The main chart compared with the previous period, with a range selected across it, the change of the range above it and its totals below the chart

Flows from source to exit: visits run from their source through the landing page and the next pages to how they ended

Bounce rate and page views, now even more precise, and the funnel chart is back

Every figure that builds on page views now follows one precise definition: a page view is every page a visitor opens, and a visit bounces when it has exactly one page view.

  • Bounce rate = visits with exactly one page view ÷ all visits. Zenovay counts every page each visit opens, so bounce rate and page views now reflect your visits even more precisely, also for past periods
  • What counts as a page view. Page loads, reloads and route changes in single-page apps. Time on page, scrolling, clicks and events do not change the bounce rate. GA4 uses an engagement rule (10 seconds, a key event or 2 page views), so its bounce rate is usually lower than Zenovay's
  • The same numbers everywhere. The Analytics tab, Home, the client portal and shared dashboards use one calculation, and filters on a shared dashboard apply to its totals too
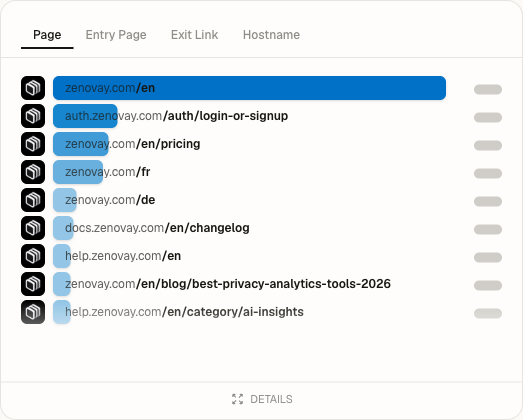
  • Pages by page view. On the Analytics tab, the Page tab ranks pages by page views and shows each page's visits, exit rate and median time on page when you hover a row. The Entry Page tab lists the page each visit started on, together with its bounce rate
  • Bounce rate by page in Retention counts the visits that started on each page, so the pages add up to your site-wide bounce rate
  • Reports, Daily Movers, benchmarks, AI insights, exports, the API, the CLI and MCP use the same definition for their daily figures, for past days too, so new reports can show different figures than earlier ones. A day's figures are final two days later, once all its visits have ended. Page views stored before October 10, 2026 keep their values
  • Users in Journeys, the weekly summary email and Ask Zenovay count visits and page views the same way, and so does the Pages viewed filter
  • Imported history keeps the bounce rate of the tool it came from. Days for which that tool has no bounce rate are left out of the average
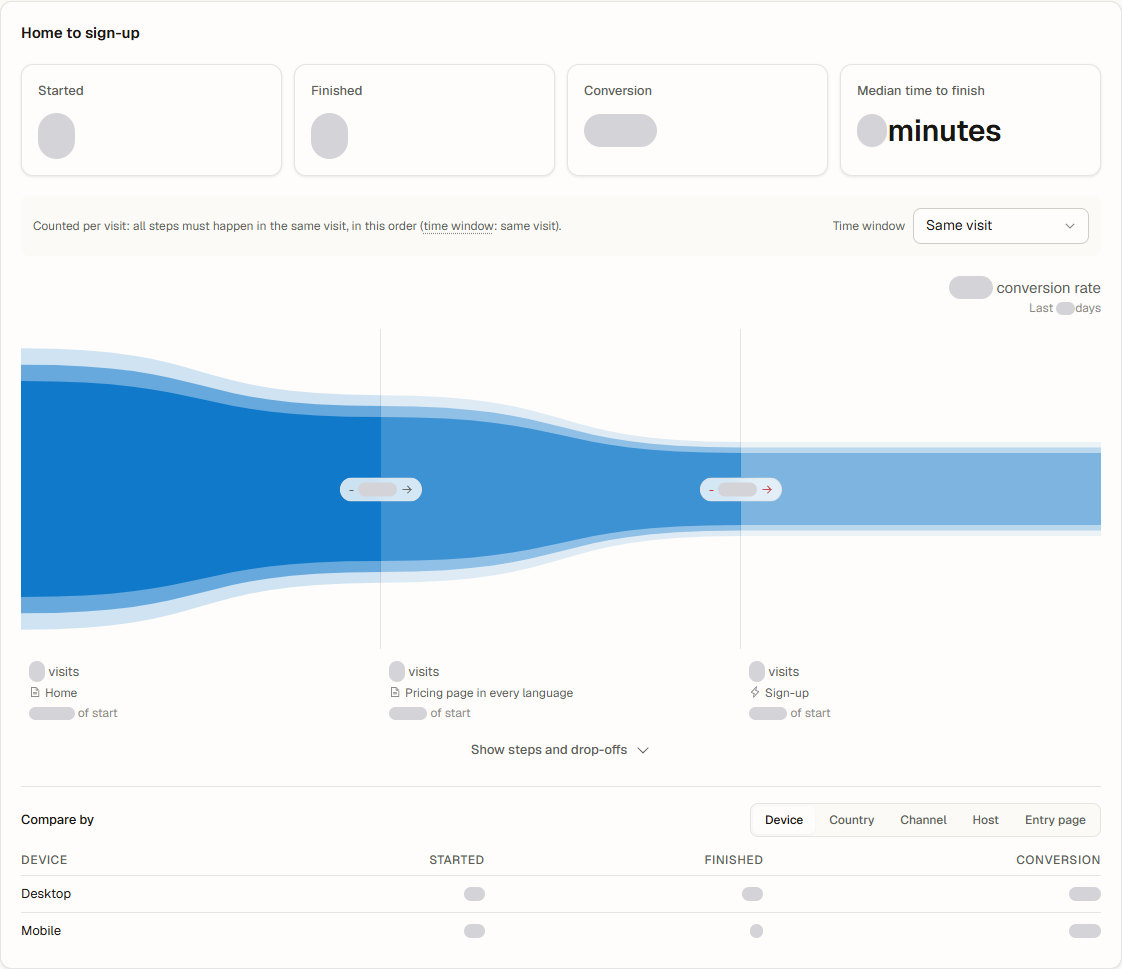
  • The funnel chart is back. Hover a step to see its drop-off, conversion, typical time from the previous step and its top channels and countries. Click the chart to open the step list with See why. On phones it runs top to bottom
  • Every funnel within reach. "Show all" lists all your funnels, and the funnel you are looking at always stays visible
  • Full step names in the funnel builder preview, and goal and funnel names stay unique regardless of upper and lower case

Funnels in Journeys: the funnel chart with three steps, the visits at each step and the drop-off between them

Stripe revenue: missed payments recovered, each payment counted once

Zenovay now checks your connected Stripe account every hour and makes sure every paid charge shows up in your revenue, exactly once.

  • Missed payments are recovered automatically. If a Stripe payment never reached Zenovay, for example because a webhook endpoint was removed or a restricted key expired, it is added on the date it was paid, so your totals and charts match Stripe
  • Subscription renewals count in MRR. On newer Stripe API versions, renewals were saved without their subscription and left out of MRR. They are now linked to their subscription
  • Each payment counted once. On newer Stripe API versions, one subscription payment could be recorded two or three times. New payments are recorded once
  • Clear connection status. Revenue settings show "Verification failed" when Stripe stops accepting your connection, and "Last verified" shows the latest successful check

Journeys: goals and funnels rebuilt

Goals and funnels now work from the data you already have: pick any period and see real numbers right away, history included.

  • History right away. Goals and funnels are calculated from your recorded data for the period you pick. A new goal or funnel shows its history immediately, and editing one recalculates the past
  • Manage everything in one place. Every goal and funnel has a menu to edit, rename, duplicate, pause and delete, also on phones
  • Details for every goal. Click a goal to see its trend, where conversions come from, the real pages it counts and the latest conversions, each linked to the visitor's timeline
  • Pick real pages. A page picker lists your site's real pages with their visits, and a live preview shows what a rule matches before you save
  • New goal type: a click on a link. Count clicks on links to your app, a booking page or a partner site, without code
  • Patterns that fit your site. "Matches a pattern" with *, ** and {locale} covers every language version of a page in one rule, for example /{locale}/pricing
  • Funnel time windows. Count a funnel within the same visit, or within 1, 7 or 30 days for longer decisions
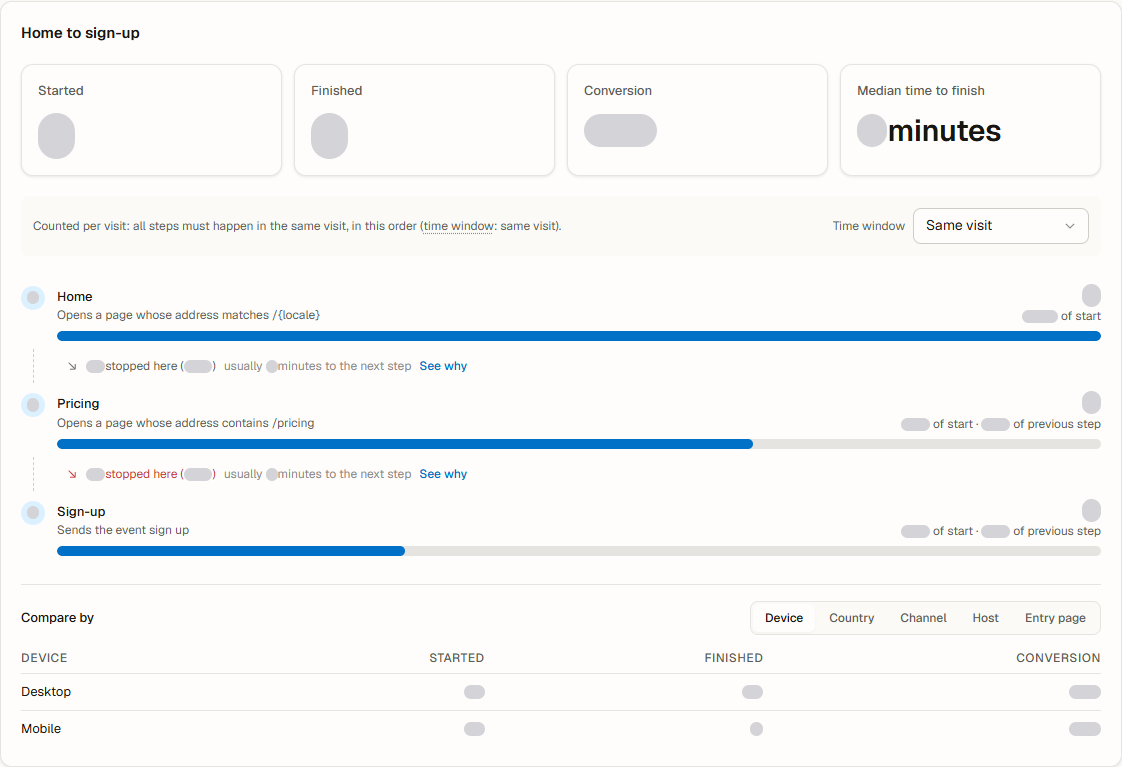
  • See why visitors stop. The drop-off panel shows where visitors went instead, who stops most often, the latest visits that stopped and a short AI explanation in plain words
  • Compare by device, country, channel, host or entry page
  • Funnel ideas built from the paths your visitors really take, and Create a funnel from this path in Flows
  • Correct counting across pages and subdomains. With the same tracking code, a visit is counted as one visit across pages and subdomains, also in cookieless mode
  • More accurate page view totals in reports. Since October 10, 2026, the regular activity signals an open tab sends no longer count as page views in the daily totals behind reports, the weekly summary email, AI insights, exports, the API and MCP. Page view totals there can be noticeably lower from that day on, earlier days stay as they were. The Analytics tab was not affected
  • Cookieless until consent. With data-cookieless="until-consent" the tracker stays cookieless until your banner calls zenovay('consent', 'granted'), then switches to its cookie without splitting the ongoing visit

The Funnels tab in Journeys: a three-step funnel with Started, Finished and Conversion, and how many visitors stopped between the steps

Scroll Depth counts every page view

Scroll depth is now measured for each page view, so every page gets complete numbers, including the pages people reach by clicking through your site.

  • Every page view counts. A visit that opens your homepage, then pricing, then sign-up now adds a view to each of the three pages, each with how far the visitor scrolled on that page. Until now only visits that stayed on a single page could be counted
  • Single-page apps included. Each route change is measured as its own page view, and a page that is still loading is never counted as read to the end
  • Same basis everywhere. The Scroll Depth card, My pages and the scroll heatmap overlay count the same page views
  • API. avg_scroll_depth in GET /api/v1/analytics/pages now reports the measured average for each page
  • Works with your existing tracking code. Data from before this update stays as it was: for those dates the card still counts visits that viewed a single page

Watch your own pages in Scroll Depth, with more accurate numbers

The Scroll Depth card can now follow any page you choose, and its numbers per page are more accurate.

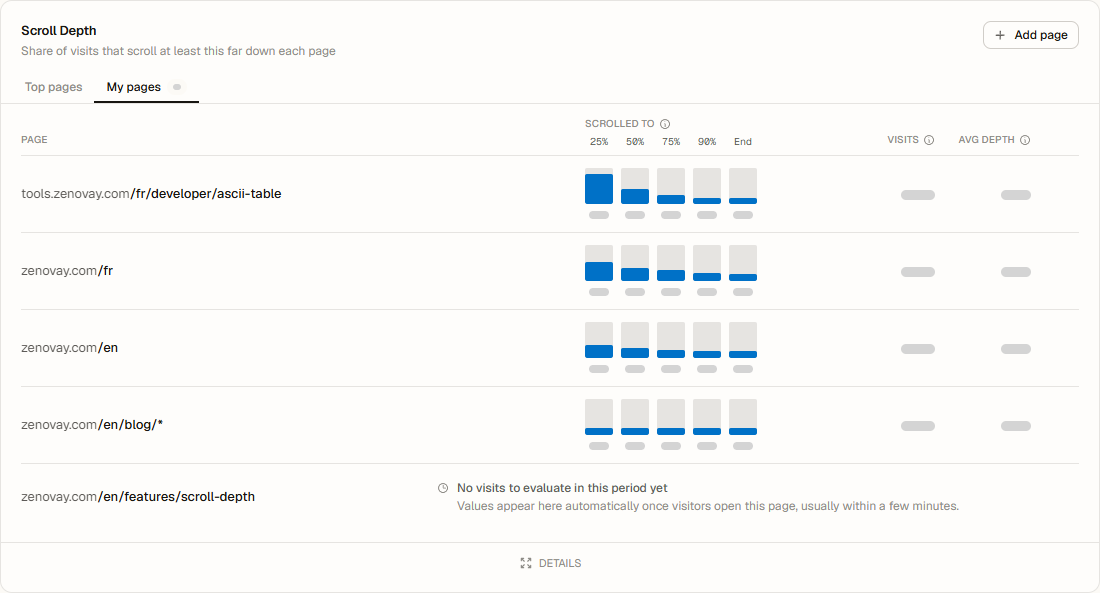
  • My pages. Add a page by URL, by path or as a whole section such as /blog/*, or pin a page straight from Top pages with the bookmark icon. A page you add shows its visits for the selected period right away; a page without visits yet says so and fills in within minutes of its next visit. Up to 25 pages per website, shared with your workspace
  • More accurate numbers per page. A visit's scroll value covers every page it saw, so a page people reach by clicking through your site, such as pricing, was credited with the scroll on the page before it and often looked much deeper than it was. The card now counts visits that viewed only that page, and Avg depth is the true average. Expect lower, more realistic numbers for such pages
  • A chart that explains itself. The depth labels (25% to End) sit once above the bars, and hovering a bar shows the counts behind it, for example "27% of visits (54 of 200) scrolled at least 50% down the page"
  • Fits any width. In a half-width card or on a phone, each row stacks instead of running off the side
  • Filtered and unfiltered views now count pages the same way

The My pages tab of the Scroll Depth card: four watched pages with their scroll bars, a /blog/* section combined into one row, and a newly added page waiting for its first visits

Crawler content freshness checks every tracked page again

Pages already tracked on the Crawler content freshness card stopped being re-checked, so their last-checked dates froze, some as early as August, and a later edit to those pages could go unnoticed. Every tracked page is re-checked again in the daily sweep, starting with the next run.